Assessment
The social development sector has generally shown improved access to quality service delivery in health, nutrition and population; education, training and culture; housing; social protection; and asset reform efforts and initiatives. The Philippines is on track in meeting the MDGs on food poverty, gender equality in education, child mortality, malaria, tuberculosis, and access to sanitary toilet facilities (Annex 8.1). However, the country lags in achieving universal primary education, improving maternal health, and combating HIV/AIDS. Moreover, large discrepancies across regions need to be addressed in the next six years.
The poverty incidence of families slightly decreased from 21.1 percent in 2006 to 20.9 percent in 2009, or from 26.4 percent of the population in 2006 to 26.5 percent in 2009. However, this improvement is limited, considering the slow growth of incomes, increase in household formation, natural disasters and inflationary pressures mainly from rising fuel and food prices. In 2009, more than a quarter of the 23.1 million poor Filipinos lived in four regions (Annex 8.2). While only one-third of poor Filipinos came from Mindanao, more than half of the provinces in the bottom cluster are located in the island group (Annex 8.3). This situation can be attributed to the armed conflict and unsettled peace and order situation.
Figure 8.1. Poverty Incidence in Southeast Asia
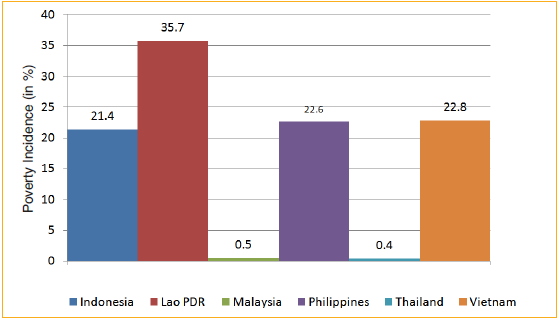
Source: ADB, 2009
Using the US$1.25-a-day poverty threshold (at 2005 prices), the Philippines, with a headcount poverty index of 22.6 percent (adjusted for 2005 purchasing power parity), ranked better than Cambodia (40.2%), Lao PDR (35.7%) and Vietnam (22.8%), but trailed behind Indonesia (21.4%), Malaysia (0.5%) and Thailand (0.4%) (Figure 8.1).
Income inequality remains high. The Gini concentration ratios1 showed only slight and slow improvements, from 0.4605 in 2003 to 0.4580 in 2006 and 0.4484 in 2009. The regions with the most unequally distributed income are Regions 7, 8, 9, 10 and 13 (CARAGA), as these regions have Gini ratios higher than 0.45 (Annex 8.4).
Trends in the Human Development Index (HDI)2 showed slight improvements. The HDI for the Philippines rose from 0.744 in 2005 to 0.751 in 2007, placing the country in the medium-HDI category (i.e., HDI values between 0.50 and 0.80). The Philippines ranked 105th among 182 countries. However, the country's Gender Development Index (GDI) decreased from 0.768 in 2005 to 0.748 in 2007. Likewise, the Gender Empowerment Measure (GEM) fell from 0.590 in 2005 to 0.560 in 2007 (United Nations Development Programme, 2007, 2009).
Income gap3, poverty gap4, and severity of poverty5 varied in a narrow range from 2006 to 2009. In 2009, Region 9 recorded the highest income gap at 30.8 percent, with National Capital Region (NCR) the lowest at 16.9 percent. The NCR also had the lowest gap at 0.4 percent, with CARAGA the highest at 12.1 percent (Annex 8.5).
Figure 8.2. Share of Social Services in Total National Government Expenditures
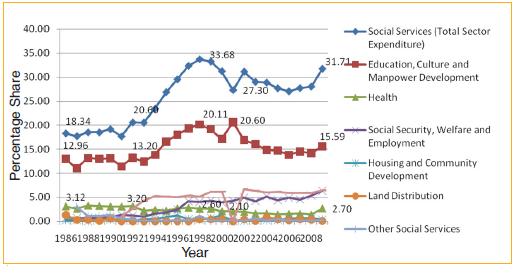
Source: DBM
It has been estimated that the national government and the LGUs must boost their budget for basic education and health by PhP348.9 billion (or 0.45% of GDP) and PhP45.0 billion (or 0.04% of GDP), respectively, if the MDG targets are to be met by 2015 (Manasan, 2009). This implies a huge financial requirement that should be allocated by the government, if it is to invest in the two most important human capital forming subsectors.
The slow rate of progress in the social sector may be partly attributed to the compression of expenditure at the national level in previous years, in response to balancing the budget due to declining revenue efforts. The combined share of social services in total national government expenditures exhibited a well defined downtrend from 1998 to 2005 (Figure 8.2).
______________________________________________________________________________
1 The Gini concentration ratio measures the inequality in income distribution, where zero means perfect equality and a value of 1 implies perfect inequality.
2 The HDI measures quality of life or wellbeing in terms of health, education and income.
3 Income gap refers to the average income shortfall expressed as a proportion to the poverty line of families with income below the poverty threshold.
4 Poverty gap is the total income shortfall of families with income below the poverty threshold, divided by the number of families.
5 Severity of poverty measure is the total of the squared income shortfall of families with income below the poverty threshold, divided by the total number of families.
- Health, Nutrition and Population
- Education, Training and Culture
- Housing and Urban Development
- Meeting the Enormous Housing Need and Demand
- Rapid Growth of Informal Households and Settlements
- Strained Basic Shelter, and Urban Services and Fiscal Constraints
- Social Protection
- Children
- Women
- Elderly
- Persons with Disability
- Workers in the Informal Sector (IS)
- Overseas Filipino Workers (OFWs)
- Displaced Workers
- Workers with HIV and AIDS
- Victims of Disasters
- Indigenous Peoples
- Asset Reform