... mineral resource development is delivering mixed results
The mining industry in the Philippines has rebounded due to the promotion and revitalization of responsible mining and recognition of the industry's possible contribution in inducing economic growth, attracting investments and reducing poverty in the countryside. Challenges remain on the emerging framework of responsible mining specifically on corporate accountability, voluntary compliance among companies and giving of due recognition to local autonomy and indigenous peoples' rights.
Figure 10.2. Distribution of Active Faults and Trenches
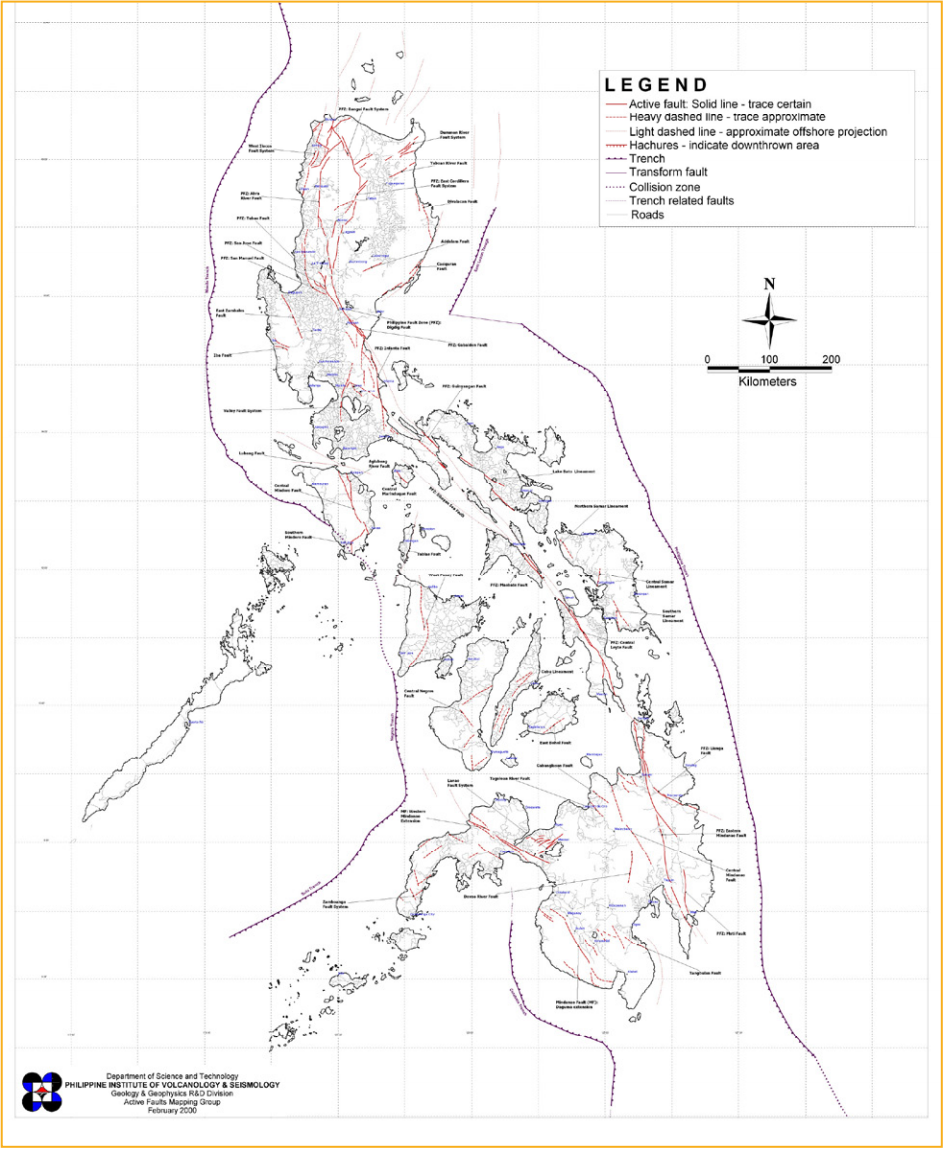
Source: PHIVOLCS
Of the country's 30 million hectares of land area, 9 million hectares (30%) is considered as having high mineral potential. Only 2.7 percent of this high-potential area is covered by mining permits or contracts and only 0.32 percent is in the development or operating stage. The mining industry's potential as a driver of economic growth has led to the revitalization of the sector in the last six years.12 As a result, investments in priority mineral exploration, development and processing projects from 2006-2009 have reached US$2.2 billion, and the production of gold, copper, and nickel has also increased. Nickel production increased by 651 percent, buoyed by favorable prices, while copper production rose by 141 percent in the same period. The value of mineral production increased by 46.34 percent from PhP72.5 billion in 2006 to PhP106.1 billion in 2009. Mining contributed 1.3 percent to GDP, or a gross value added of PhP97.1 billion in 2009 (at current prices). With the expected operation of five metallic mines and one cement plant, output value is projected to increase by 30 percent to PhP138.5 billion in 2010. For the period 2006 to 2009, employment in mining and quarrying increased from 141,000 to 166,000 (0.50 %), while taxes, fees and royalties from the minerals industry rose by 93.7 percent, from PhP6.39 billion in 2006 to PhP12.38 billion in 2009.
Figure 10.3. Frequency of Tropical Cyclones in the Philippines, 1948-2006
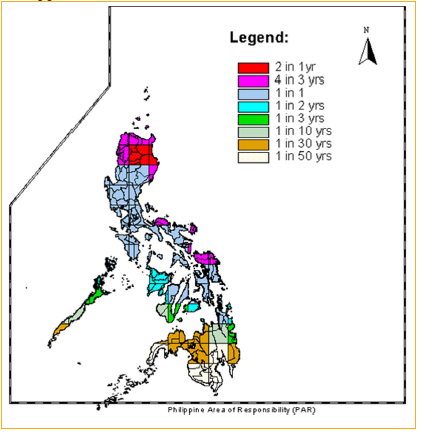
Source: PAGASA
Table 10.1. Top 20 Provinces Susceptible to Floods
| Provinces | Rank | Area Susceptible to Flooding (%) |
| Pampanga | 1 | 79.5 |
| Nueva Ecija | 2 | 51.2 |
| Pangasinan | 3 | 48.1 |
| Tarlac | 4 | 47.1 |
| Maguindanao | 5 | 42.5 |
| Bulacan | 6 | 39.9 |
| Metro Manila | 7 | 33.2 |
| Cotabato (North Cotabato) | 8 | 30.1 |
| Oriental Mindoro | 9 | 28.7 |
| Ilocos Norte | 10 | 27.9 |
| Iloilo | 11 | 26.7 |
| La Union | 12 | 26.3 |
| Cagayan | 13 | 25.5 |
| Sultan Kudarat | 14 | 24.4 |
| Ilocos Sur | 15 | 23.4 |
| Bataan | 16 | 23.1 |
| Leyte | 17 | 20.8 |
| Davao Del Norte/Compostela Valley | 18 | 20.2 |
| Compostela Valley/Davao Del Norte | 19 | 20.2 |
| Camarines Sur | 20 | 19.2 |
Source: DENR-Mines and Geosciences Bureau (MGB), 2010.
Data show that the share of mining in GDP and employment is increasing and there are considerable potentials. However, target investments and excise tax from mining in 2004-2010 have not been fully achieved due to the financial crisis, among others. In addition, an assessment report of a mining project has indicated that the fair share of the government from mining has not been achieved due to the existing incentive mechanism.13 Issues have been also raised on sharing of the mining industry with regard to foreign companies as well as the undesirable environmental conditions which the Filipino communities will have to deal with.
Table 10.2. Top 20 Provinces Susceptible to Landslides
| Provinces | Rank | Area |
| Misamis Occidental | 1 | 90.3 |
| Quirino | 2 | 87.1 |
| Bulacan | 3 | 86.7 |
| Basilan | 4 | 84.7 |
| Bukidnon | 5 | 84.7 |
| Surigao Del Norte | 6 | 82.6 |
| Quezon | 7 | 82.1 |
| Camarines Sur | 8 | 78.6 |
| Lanao Del Norte | 9 | 77.6 |
| Camarines Norte | 10 | 77.4 |
| Zamboanga Del Norte | 11 | 77.3 |
| Northern Samar | 12 | 74.5 |
| Pampanga | 13 | 74.4 |
| Metro Manila | 14 | 72.9 |
| Pangasinan | 15 | 71.5 |
| Davao Oriental | 16 | 70.9 |
| Southern Leyte | 17 | 70.1 |
| Aurora | 18 | 68.9 |
| Cotabato (North Cotabato) | 19 | 67.9 |
| Sulu | 20 | 67.4 |
In separate researches, it was found that mining permits or contracts were within half the number of titled and claimed ancestral domains.
A number of mining projects, however, have been alleged to have caused environmental degradations, physical displacement of indigenous peoples, and cultural dislocations. In 2005, a European Union (EU)-commissioned study reported that legal and illegal mining operations posed serious threat to the forest and to local rivers because of forest clearing and the release of toxins.14 Metallic mine waste generated from 1990 to 1999 amounted to 131 million metric tons (MT), while mine tailings were about 136 million MT.15 Many of these concerns stem from the failure of many small and large-scale mining companies to adhere to stringent, globally-defined standards for responsible mining.
Table 10.3.Hazard Susceptibility of Selected Provinces by Poverty Incidence
| Province/Region | 2006 Pov. Inc |
| Susceptibility to hazards |
| Typhoon frequency | ||
|
| % | Rank |
| Flood | RIL |
|
|
| Tawi-Tawi | 78.9 | 1 |
| 0.8 | 5.7 |
| 1 in 50 yrs |
| Zamboanga Del Norte | 63.0 | 2 |
| 3.2 | 50.1 |
| 1 in 50 yrs |
| Maguindanao | 62.0 | 3 |
| 42.5 | 23 |
| 1 in 50 yrs |
| Apayao | 57.5 | 4 |
| 7.2 | 84.7 |
| 4 in 3 yrs |
| Surigao Del Norte | 53.2 | 5 |
| 9.8 | 35 |
| 1 in 1 yr |
| Lanao Del Sur | 52.5 | 6 |
| 7.6 | 41.4 |
| 1 in 30 yrs |
| Northern Samar | 52.2 | 7 |
| 14.9 | 49.6 |
| 4 in 3 yrs |
| Masbate | 51.0 | 8 |
| 5.7 | 28.8 |
| 1 in 1 yr |
| Abra | 50.1 | 9 |
| 7.6 | 82.1 |
| 4 in 3 yrs |
| Misamis Occidental | 48.8 | 10 |
| 3.5 | 50 |
| 1 n 30 yrs |
| Agusan Del Sur | 48.7 | 11 |
| 15.3 | 51.4 |
| 1 n 10 yrs |
| Oriental Mindoro | 47.1 | 12 |
| 28.7 | 54.6 |
| 1 n 1 yr |
| Sulu | 46.5 | 13 |
| no data | 10.4 |
| 1 n 50 yrs |
| Occidental Mindoro | 46.5 | 13 |
| 18.3 | 63.5 |
| 1 n 1 yr |
| Kalinga | 45.8 | 15 |
| 7.2 | 84.7 |
| 2 in 1 yr |
| Surigao Del Sur | 45.4 | 16 |
| 11.1 | 48.3 |
| 1 in 3 yrs |
| Mountain Province | 45.0 | 17 |
| 0.8 | 87.1 |
| 2 in 1 yr |
| Sarangani | 44.8 | 18 |
| 5.3 | 67 |
| 1 in 50 yrs |
| Lanao Del Norte | 44.1 | 19 |
| 11.7 | 54.9 |
| 1 in 30 yrs |
| Negros Oriental | 43.7 | 20 |
| 5.6 | 51 |
| 1 in 3 yrs |
| Sorsogon | 43.5 | 21 |
| 13.7 | 47 |
| 4 in 3 yrs |
| Antique | 43.0 | 22 |
| 13.6 | 74.5 |
| 1 in 2 yrs |
| Eastern Samar | 42.7 | 23 |
| 8.5 | 62.1 |
| 4 in 3 yrs |
| Aklan | 42.6 | 24 |
| 18.3 | 66.5 |
| 1 in 2 yrs |
| Romblon | 41.9 | 25 |
| 10.7 | 58 |
| 1 in 1 yr |
| Camarines Sur | 41.2 | 26 |
| 19.2 | 38 |
| 1 in 1 yr |
| Davao Oriental | 40.8 | 27 |
| 7.9 | 70.1 |
| 1 in 30 yrs |
| Palawan | 40.8 | 27 |
| 10.3 | 43.7 |
| 1 in 3 yrs |
| Marinduque | 40.8 | 27 |
| 10.6 | 78.6 |
| 1 in 1 yr |
| Sultan Kudarat | 40.7 | 30 |
| 24.4 | 52.1 |
| 1 in 50 yrs |
| Leyte | 40.5 | 31 |
| 20.8 | 49.5 |
| 1 in 1 yr |
| Samar | 40.2 | 32 |
| 6.2 | 68.9 |
| 1 in 1 yr |
Sources: NSO, NSCB, MGB, PAGASA, UNDP
Ensuring the equitable and just distribution of benefits from extracted mineral resources remains to be a challenge.
Currently, there is no standard resource and environment valuation. There is a need to have a cost-benefit analysis and standard parameters that will consider all relevant values (including nonmarket values).
_____________________________________________________________________________________________
12 DENR-MGB, Mining Industry Statistics, 2011
13 DENA, Assessment of the Rapu- Rapu Polymetalic Project, 2006.
14 EU, Commission Country Environment Profile, 2005
15 EU, Commission Country Environment Profile, 2005