2.3.3.1 Infrastructure-related issues - general observations
The precise role of infrastructure within overall MFP growth is difficult to measure, since ABS data classifies infrastructure as part of the capital stock of the industry with which it is associated. While it is therefore possible to obtain data on MFP within an industry, it is more difficult to obtain an indication of the broader economy-wide productivity implications of changes in the infrastructure sectors.37
Figure 6 uses national accounts data from the ABS to show the infrastructure sectors' share of the national economy since 1985-86.38 This figure shows that the sectors' overall share of GDP has held fairly steady over that period, between 9.9 and 11.0 per cent.
The transport-related industries' share of GDP has been relatively steady over the period. Slight growth in the share of the information, media and telecommunications industries has been offset by the declining share of the utilities industry.
Figure 6: Australian infrastructure industry gross value-add as a percentage of GDP - 1994-95 to 2013-14
|
|
|
|
| Total of all sectors | ||
| Transport, postal and warehousing | ||
| Information, media and telecommunications | ||
| Electricity | ||
| Water and wastewater services | ||
| Gas | ||
|
| ||
|
|
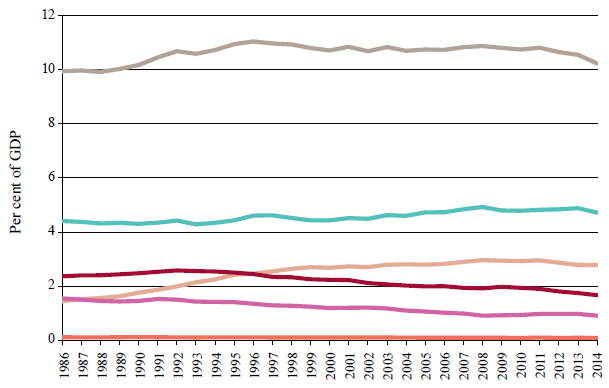


Source: Infrastructure Australia analysis of Australian Bureau of Statistics (2014d) data
These trends reflect:
■ changes in the quantity and quality of infrastructure services consumed by households and businesses, e.g. they are spending more on telecommunications as new and better services are provided, and using more energy efficient products; and
■ changes in productivity within the infrastructure sectors, e.g. sectors such as transport which, overall, have not been able to improve their productivity over the period, and sectors where declining productivity has offset savings from lower overall consumption of the underlying service - electricity is an example (see the discussion further below).
The available data does not readily allow the relative contribution of these two factors to be isolated. Nevertheless, it would be surprising if there was not scope for increasing efficiencies in the infrastructure sectors to drive MFP growth across the broader economy, through:
■ the reallocation of scarce resources to the most productive sectors and businesses (allocative efficiency);
■ better use of existing assets, and improvements in the use of the factors of production that reduce the cost of providing infrastructure services (productive efficiency); and
■ in some cases, enabling firms to innovate (so-called dynamic efficiency).39
Decreasing the share of infrastructure services as a proportion of GDP, e.g. through improved freight transport and reduced capital expenditure and maintenance costs in electricity and water assets, will reduce the cost inputs of infrastructure services to other industries.
Figure 7 compares the MFP performance of Australian infrastructure-related industries with that of the Australian market-based industries as a whole (including the three infrastructure-related industries). Closer analysis of these trends is provided below, however, the following broad trends are apparent:
■ productivity has fallen appreciably in the broad 'utilities industry'. As noted below, this is partly due to the 'lumpy' nature of both generation and network investments in the energy sector, and responses to the 'millennium drought' in the water sector;
■ productivity improvement in the transport, postal and warehousing industry has stalled since the early 2000s; and
■ productivity in the information, media and telecommunications industry has not improved since the mid-1990s. However, as the data for this industry comprises a number of sub-industries, drawing conclusions about telecommunications specifically needs to be approached with some care. In fact, there is some evidence that the telecommunications sector contributed substantially to broader productivity improvements in the 2000s.40
Figure 7: Australian industry gross value added multi factor productivity indices - 1994-95 to 2013-14
|
|
|
|
| |
| Electricity, gas, water and wastewater services | |
| Transport, postal and warehousing | |
| Information, media and telecommunications | |
| 16 market sector industries | |
|
| |
|
| |
|
|
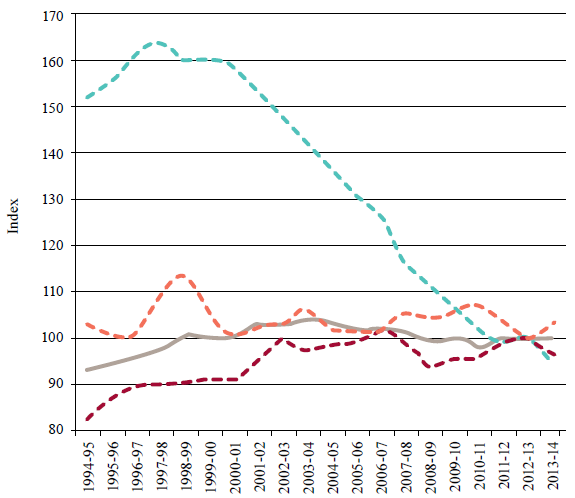


Source: Infrastructure Australia analysis of Australian Bureau of Statistics (2014d) data41
_________________________________________________________________________________
37. Australian Bureau of Statistics (2014d)
38. The national accounts data refers to 'industries'. The gross value add measure does not take account of certain factors included in the Direct Economic Contribution measure used elsewhere in the Audit. Nevertheless, it provides useful base data relevant to the Audit.
39. Carmody, C. (2013)
40. Centre for International Economics (2014) and Carmody, C. (2013)
41. The indices measure multi factor productivity on the basis of gross value added using 'quality adjusted hours worked'. 2012-13 = 100