3.2.2 International comparisons
International comparisons provide insights on the relative quality of Australia's infrastructure, although making such comparisons can present a range of difficulties, including:
■ obtaining comparable data across countries;
■ many of the comparisons involve qualitative assessments; and
■ national level assessments can mask differences at a regional or local level.
Notwithstanding these limitations, international comparisons provide some useful context when reaching a conclusion on infrastructure gaps.
In its Global Competitiveness Report 2014-15, the World Economic Forum ranked Australia's infrastructure 20th out of 144 countries.55 On a seven point scale ranging from 1 (extremely underdeveloped - among the worst in the world) to 7 (extensive and efficient - among the best in the world), Australia's infrastructure scored 5.6.
Hong Kong's score of 6.7 was the highest. Other large economies, or countries with which Australia is sometimes compared, had ranks and scores as follows: Netherlands (4th and 6.3); Germany (7th and 6.1); France (8th and 6.0); United Kingdom (10th and 6.0); United States (12th and 5.8); Canada (15th and 5.7); Italy (26th and 5.4); New Zealand (29th and 5.3) and China (46th and 4.7). Figure 8 provides a comparison of Australia's ranking with other countries. The Forum's more detailed rankings and scores for Australia's infrastructure are shown in Table 3. Australia's ranking of 35th for overall transport infrastructure quality is a cause for concern.
Figure 8: World Economic Forum overall rankings of infrastructure - 201456
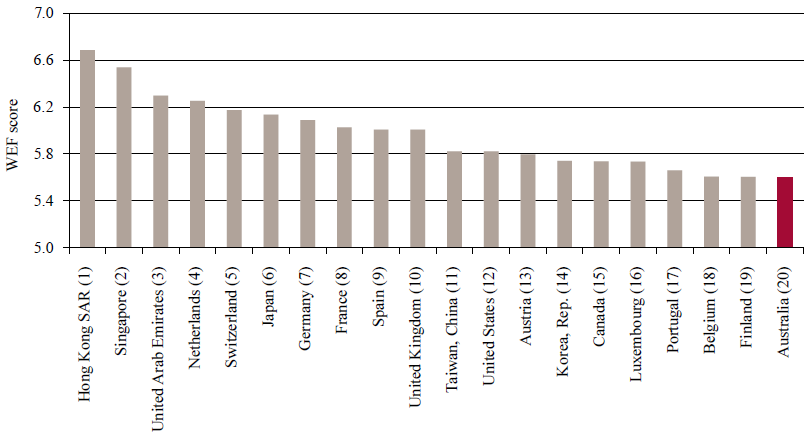
Source: Infrastructure Australia analysis of data in World Economic Forum (2014)
Table 3: World Economic Forum ranking of Australian infrastructure (out of 144 countries) - 2014
Criteria | Score | Rank |
Overall ranking of infrastructure | 5.6 | 20 |
Quality of overall transport infrastructure | 5.1 | 35 |
Quality of roads | 4.8 | 43 |
Quality of railroad infrastructure | 4.0 | 32 |
Quality of port infrastructure | 5.0 | 38 |
Quality of air transport infrastructure | 5.5 | 29 |
Available airline seat km/week, millions | 4,467.2 | 7 |
Quality of electricity supply | 6.2 | 27 |
Mobile telephone subscriptions/100 pop. | 106.8 | 81 |
Fixed telephone lines/100 pop. | 44.3 | 16 |
Source: World Economic Forum (2014)
As shown in Figure 9, the World Bank's Logistics Performance Index 2014 scored Australia's trade and transport infrastructure at 3.81 (out of a possible 5), placing the country 16th in the world.57
These patterns emphasise the fact that maintaining Australia's international competitiveness requires ongoing attention.
Figure 9: World Bank rankings - Logistics performance indices - 201458
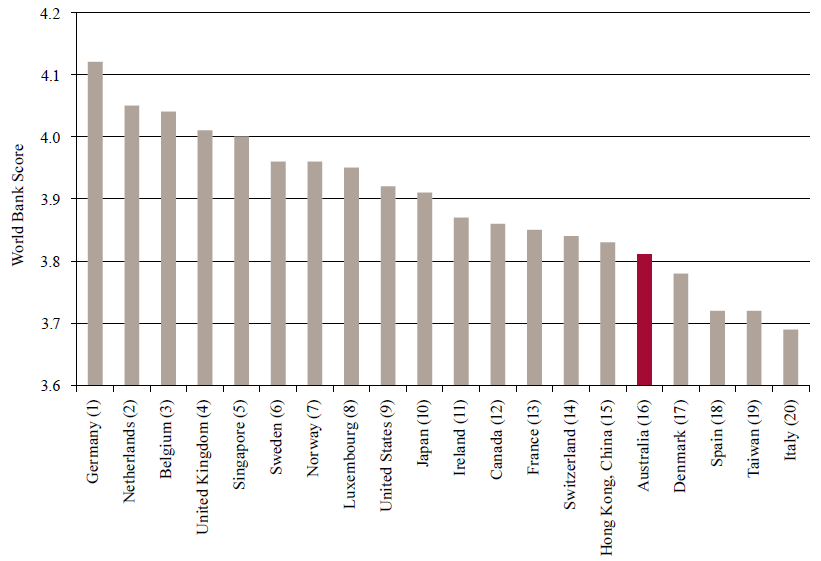
Source: World Bank (2014)
On these assessments, Australia's infrastructure cannot be considered world leading. There are factors which go some way towards explaining these rankings, such as Australia's geographic size relative to its population. Still, the results highlight real room for improvement. Other countries also with a large area relative to their population, such as Canada, rank higher than Australia.
Australian cities have often featured in international rankings of their competitiveness and 'liveability'. However, these rankings over recent years have identified weaknesses in Australian cities' infrastructure, notably their transport networks.
Statistical comparisons between countries on telecommunications services are subject to a number of variable factors but a range of recent reports and surveys indicate that by international standards in terms of coverage and speed, Australia has a high ranking mobile (wireless) broadband service and a middle ranking fixed line broadband service.
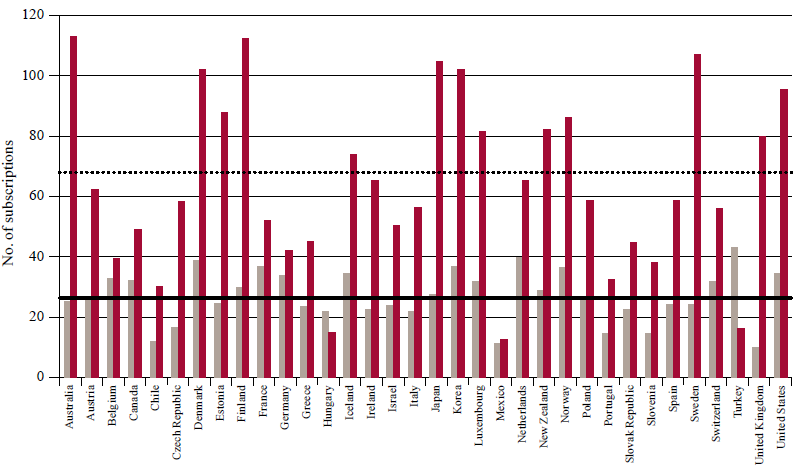
Wireless broadband subscriptions in Australia tripled between 2009 and 2014.59 This resulted in Australia having the highest wireless broadband penetration in the (Organisation for Economic Cooperation and Development) OECD. As shown in Figure 10, Australia has over 113 subscriptions per 100 inhabitants, indicating that many wireless broadband subscribers have more than one subscription. Australia has 25.6 fixed line broadband subscriptions per 100 inhabitants, which is below the OECD average of 27.6.60
In terms of average fixed line connection speeds, the Akamai State of the Internet report from the final quarter 201461 indicates that Australia has fallen three places to 44th place in terms of average download speed for fixed line broadband out of 120 countries. The average speed identified was 6.9 Megabits per second (Mbps). As a comparison, South Korea's average was 25.5 Mbps, Japan 15.0 Mbps, US 11.5 Mbps (but significantly higher in some states), Canada 10.3 Mbps and the UK 10.7 Mbps.
In terms of average mobile connection speeds, Akamai does not provide a ranking but states that Australia is achieving 3.9 Mbps. This compares with South Korea at 18.2 Mbps, Japan at 6.7 Mbps, the US at 5.8 Mbps, Canada at 7.9 Mbps and the UK at 8.1 Mbps. Australia is likely to significantly improve its average connection speed with the commencement of the 4G 700 MHz networks in 2015.
Figure 10: Number of broadband subscriptions per 100 inhabitants
|
|
|
|
 Total Fixed
 Total Wireless
Source: Organisation for Economic Cooperation and Development (2015b)
The International Telecommunications Union also conducts an annual survey, Information and Communications Technology Development Index, which ranks 166 countries. The survey focuses on fixed and mobile access as well as the use of information and communications technology (ICT) and associated skills. Australia has retained its previous ranking of 12th in the survey. Australia was ranked fourth in the Asia Pacific region after South Korea, Hong Kong and Japan.62
Another interesting indicator of where Australia fits in terms of its telecommunications infrastructure is the International Markets report, compiled by the UK telecommunications regulator Ofcom.63 The 2013 report examines 18 countries - these include UK, France, Germany, Italy, the USA, Japan, Singapore, Japan, South Korea, Canada, Spain, China and Australia. The report has some penetration figures that are broadly consistent with the OECD data, but also contains information on the monthly telecoms revenue per capita. In the survey Australians were identified as spending the highest amount on telecommunications out of all 18 countries. One of the reasons may be that Australia recorded the highest mobile penetration rate behind South Korea (in this survey) and that we have a capable mobile data network. In any event this measure indicates that Australian mobile subscribers will continue to make expenditures that will drive growth and upgrades of the networks.
OECD analysis has found that Australia has amongst the lowest percentage of fibre connections for broadband services in the developed world.64 The development of the National Broadband Network (NBN) is expected to raise this percentage progressively. Nevertheless, the analysis shows how far Australia has to catch up to other nations.
_________________________________________________________________________________
55. World Economic Forum (2014)
56. The World Economic Forum's maximum possible score is 7.0.
57. World Bank (2014)
58. The World Bank's maximum possible score is 5.0.
59. Australian Bureau of Statistics (2014e)
60. Castalia Strategic Advisors (2014)
61. Akamai Technologies (2015)
62. International Telecommunications Union (2014)
63. Ofcom (2013)
64. Organisation for Economic Cooperation and Development (2013b)