Origins/destinations of trips across the six conurbations
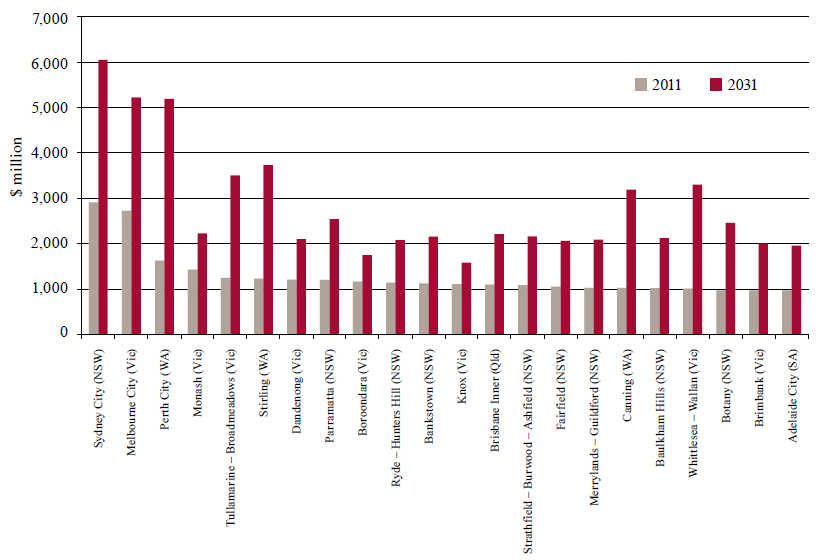
Figure 25 shows trips across the six conurbations by origin/destination (O/D), across road and public transport modes, in terms of DEC for 2011 and projected DEC for 2031. The O/D regions used here are SA3 regions as defined by the ABS. While these regions have different characteristics and are not strictly comparable, this analysis shows a number of consistent patterns. For example, it shows that demand for travel to and from the key inner city employment zones is projected to grow strongly to 2031, while demand for travel to and from emerging non-CBD employment zones, particularly in Western Australia (WA), Victoria and New South Wales (NSW), is also projected to grow strongly.
Figure 25: Trips in six conurbations by origin/destination for roads and public transport in 2011 and projected for 2031, measured by DEC ($ million, 2011 prices)
Source: Infrastructure Australia analysis of modelling data from Veitch Lister Consulting (2014a) and ACIL Allen Consulting (2014b)
Table 11: Journey to work and all-day mode share estimates for urban public transport, 2011168
Task | Sydney | Melbourne | Brisbane | Adelaide | Perth | Hobart | Darwin | Canberra | 8 capitals |
Mass transit commute share (% of all motorised JTW169 trips) | 24.9 | 17.5 | 15.8 | 10.4 | 13.6 | 7.1 | 5.6 | 8.4 | 17.9 |
Mass transit all day share (% of all motorised pkm170) | 13.6 | 11.0 | 8.6 | 6.1 | 7.1 | 3.6 | 6.0 | 4.3 | 10.3 |
Source: Bureau of Infrastructure, Transport and Regional Economics (2014a)
_________________________________________________________________________________
168. Public transport share includes specific allowances for all bus travel km (on both route and private buses).
169. JTW: journey to work
170. pkt: passenger kilometres travelled