Mode share in urban transport networks
Table 11 shows public transport's share of motorised trips to work, and of all motorised trips, in the eight capital cities in 2011. This shows that public transport has a significantly higher share of trips in Sydney than the other cities, especially for trips to work.
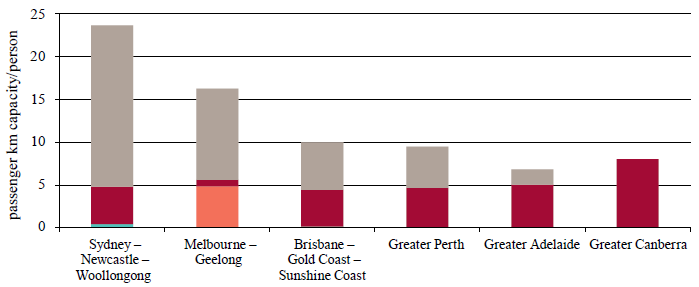
Figure 26 shows the public transport seat kilometres per person available in 2011 for each of the six conurbations analysed in the Audit. This shows a significantly higher level of public transport seat kilometres available in Sydney, and to a lesser extent Melbourne, compared to the other cities. In particular, the rail networks in Sydney and Melbourne provide significantly more seat kilometres per person than those in the other cities, reflecting their more extensive legacy rail networks, and higher utilisation of public transport generally. The public transport networks in the other cities are more dependent on buses.
Figure 26: Public transport seat km per person across six conurbations in 2011
|
|
 Rail
Rail Bus
Bus Ferry
Ferry Light Rail
Source: Veitch Lister Consulting (2014a)