Bus and light rail
Figure 28 shows that the inner city regions of Sydney and Melbourne are the most significant destinations for bus and light rail trips, by a significant margin. However the other destinations in the top 20 are more evenly spread between other cities, including entries from Adelaide and Canberra.
Table 16 shows the top 20 origin/destination pairs for bus trips nationally, by passenger hours per day travelled, and Table 17 shows the top 10 origin/ destination pairs for light rail trips on the same basis. Again this shows the inner city regions of Sydney and Melbourne as part of the most dense origin/destination pairs for bus and light rail respectively. For bus trips, origin/destination pairs in the top 20 are spread across all six cities.
Figure 28: Top 20 bus and light rail destinations nationally by passenger hours travelled (PHT) per day in 2011 and projected for 2031
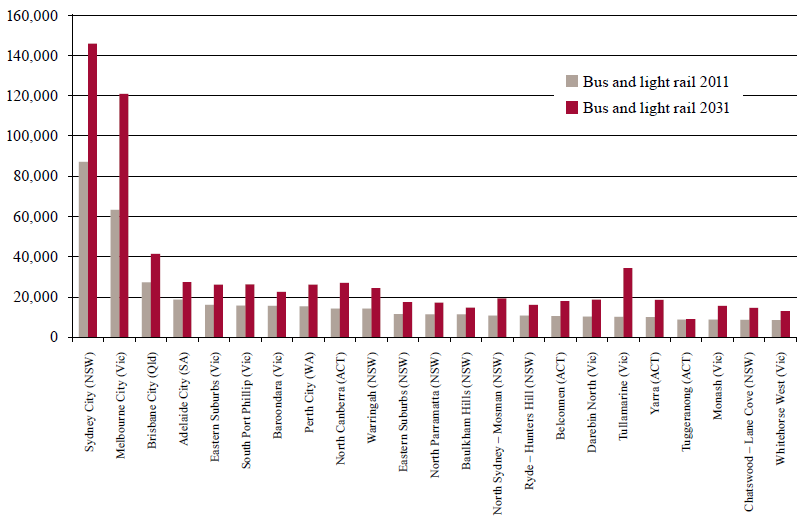
Source: Infrastructure Australia analysis of data from Veitch Lister Consulting (2014a)
Table 16: Top 20 origin/destination pairs for bus trips by passenger hours travelled (PHT) per day in 2011
From - SA3 | To - SA3 | Passenger-hours/day Utilisation (PHT) Bus |
Eastern Suburbs - South | Sydney Inner City | 10,126 |
Eastern Suburbs - North | Sydney Inner City | 8,122 |
Warringah | Sydney Inner City | 7,816 |
Ryde - Hunters Hill | Sydney Inner City | 3,900 |
North Sydney - Mosman | Sydney Inner City | 3,307 |
Chatswood - Lane Cove | Sydney Inner City | 2,983 |
Belconnen | North Canberra | 2,933 |
Manningham - West | Melbourne City | 2,920 |
Stirling | Perth City | 2,772 |
Mt Gravatt | Brisbane Inner | 2,200 |
Tuggeranong | North Canberra | 2,113 |
Strathfield - Burwood - Ashfield | Sydney Inner City | 2,093 |
Kenmore - Brookfield - Moggill | Brisbane Inner | 1,855 |
Carindale | Brisbane Inner | 1,850 |
Holland Park - Yeronga | Brisbane Inner | 1,819 |
Tea Tree Gully | Adelaide City | 1,712 |
Gungahlin | North Canberra | 1,683 |
Rocklea - Acacia Ridge | Brisbane Inner | 1,663 |
Adelaide Hills | Adelaide City | 1,629 |
Onkaparinga | Adelaide City | 1,553 |
Source: Infrastructure Australia analysis of modelling data from Veitch Lister Consulting (2014a) and ACIL Allen Consulting (2014b)
Table 17: Top 10 origin/destination pairs for light rail/tram trips by passenger hours travelled per day in 2011
From - SA3 | To - SA3 | Passenger-hours/day Utilisation (PHT) Light Rail |
Boroondara | Melbourne City | 6,315 |
Glen Eira | Melbourne City | 2,685 |
Whittlesea - Wallan | Melbourne City | 1,218 |
Banyule | Melbourne City | 892 |
Tullamarine - Broadmeadows | Melbourne City | 350 |
Monash | Melbourne City | 303 |
Brimbank | Melbourne City | 193 |
Manningham - West | Melbourne City | 188 |
Kingston | Melbourne City | 187 |
Marion | Adelaide City | 144 |
Source: Infrastructure Australia analysis of data from Veitch Lister Consulting (2014a)