7.1.2.1 Existing capacity
The national highways considered by the Audit measure 34,656 km, comprising:
■ 20,022 km of interstate routes connecting capital cities; and
■ 14,635 km of key freight routes.
Figure 29 shows the national highways covered by the Audit. These carried an average of 1.87 million vehicles per day in 2011.175
Figure 29: National highways
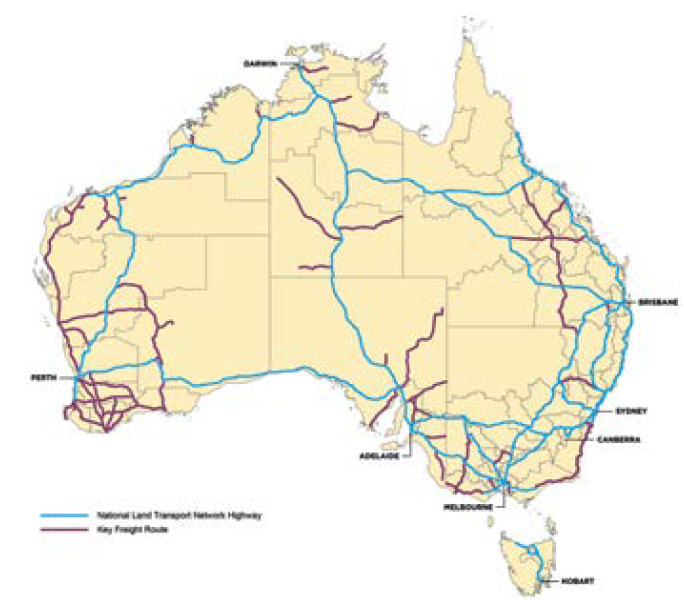
The map shows highways identified in the Audit. Data was not available for all of these highways.
Source: Infrastructure Australia
Across Australia, the Audit found that the average national highway utilisation in 2011 was:
■ 3,550 vehicles per day per kilometre on interstate routes connecting capital cities, consisting of:
- 2,602 light vehicles (73 per cent); and
- 948 heavy vehicles (27 per cent)
■ 1,648 vehicles per day per kilometre on key freight routes, consisting of:
- 1,339 light vehicles (81 per cent); and
- 308 heavy vehicles (19 per cent).176
The Audit found that the total DEC generated by national highways in 2011 was $9.5 billion. Table 19 provides details of DEC by state and territory, expressed in millions of dollars and as a percentage of the national total.
Table 19: DEC for national highways by state and territory in 2011 ($ million, 2011 prices)
State | Share of national total | |
| ($m) | % |
3,598 | 37.9% | |
Victoria | 1,493 | 15.7% |
Queensland | 2,393 | 25.2% |
512 | 5.4% | |
726 | 7.6% | |
Tasmania | 279 | 2.9% |
502 | 5.3% | |
0 | 0.0% |
Source: ACIL Allen Consulting (2014a)
NSW had the highest DEC for national highways in 2011, with a total value of $3.6 billion, or 37.9 per cent of the national total. The ACT did not have any national highways outside the urban transport area measured by the Audit.
_________________________________________________________________________________
175. ACIL Allen Consulting (2014a)
176. ACIL Allen Consulting (2014a)