7.1.2.2 Demand projections
Demand for national highways will continue to be driven by two primary groups of users:
■ heavy vehicles, facilitating industrial production through freight transportation; and
■ light vehicles, enabling small business, household and community activities.
The overall trend in vehicle kilometres travelled (VKT) has been consistent growth over the past century. This has been supported by strong growth in per capita car ownership and relatively low domestic fuel prices compared to global markets over much of this period.177 However, there has been a decline in VKT per person since 2009. This can be largely attributed to the light vehicle market approaching saturation, increasing competition from domestic air travel, domestic petrol prices catching up to world oil prices, and generational changes in travel demand.
In terms of heavy vehicle demand for national highways, the then Standing Council on Transport and Infrastructure estimated that the national land freight task is expected to nearly double over the period from 2010 to 2030 - with a large component of this task expected to be handled by road freight vehicles.178 This growth projection is broadly supported by the Bureau of Infrastructure, Transport and Regional Economics (BITRE), which expects growth of 80 per cent from 2011 to 2031,179 as does modelling by the New South Wales (NSW) Government.180
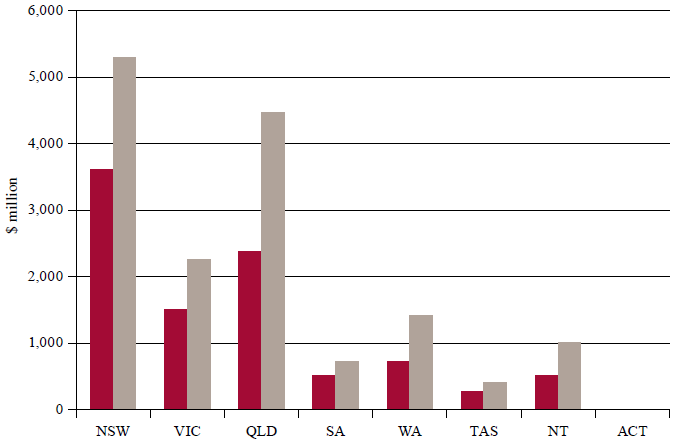
The Audit forecasts the DEC of national highways across Australia to be $15.6 billion in 2031. Figure 30 shows the projected DEC for national highways by state and territory.
Figure 30: DEC for national highways by state and territory in 2011 and projected 2031 ($ million, 2011 prices)
|
|
 2010-11
 2030-31
Source: ACIL Allen Consulting (2014a)
While NSW is projected to continue to have the highest DEC for national highways in 2031, with 34 per cent of the national total, high levels of growth are expected in Queensland and Western Australia (WA). This is expected to be driven by strong population growth and investments in the mining and resources sector.
The Northern Territory (NT) is forecast to experience the highest growth of DEC for national highways, with 101 per cent growth from 2011 to 2031. However, the NT will remain a relatively small element of the national network, with only 6.5 per cent of the total Australian DEC for national highways.181
The overall growth in DEC for Australian national highways of $6.1 billion represents a total growth of 63.9 per cent over the period from 2011. This constitutes an average annual growth rate of 2.5 per cent.
This projected growth is slightly lower than the projected growth in GDP, reflecting the expectation that the declining growth in the productivity of heavy vehicles relative to the overall freight task may lead to a lower modal share for road freight. The economic contribution of the national highways is also projected to grow at a slower rate than other transport infrastructure services, such as ports and rail, which are expected to experience greater growth from factors such as export demand for minerals.
_________________________________________________________________________________
177. Bureau of Infrastructure, Transport and Regional Economics (2012a)
178. Standing Council on Transport and Infrastructure (2012)
179. Bureau of Infrastructure, Transport and Regional Economics (2014b)
180. New South Wales Government (2013)
181. ACIL Allen Consulting (2014a)