7.1.3.1 Existing capacity
The national rail network is extensive, covering 33,299 operational route-kilometres.
In 2011, the domestic rail freight task totalled 261.4 billion tonne kilometres, accounting for approximately 46 per cent of total domestic freight. This represents an increase of 91 per cent since 2000-01. In that year, rail freight accounted for 37 per cent of the total domestic freight task, indicating significant growth in the mode share of rail freight over this period.192
Mining freight dominates the rail network in terms of tonnages carried, much of it on privately owned or leased railways such as the Pilbara lines of BHP, Rio Tinto and Fortescue. Iron ore and coal exports accounted for over 80 per cent of the rail freight task in 2011.193 Relatively small volumes of grain and agricultural produce are also transported in NSW, Victoria, WA and Queensland.
Freight rail was also heavily used by metals manufacturing (movement of ore and movement of bulk steel between Whyalla, Hastings and Port Kembla/Sydney), and non-metals manufacturing, for example moving components and finished goods.
The Audit estimated the DEC for rail infrastructure services to be $5.4 billion in 2011. Figure 34 shows the distribution of DEC in 2011 for each state and territory.
Figure 34: Value-add for rail infrastructure services by state and territory in 2011, measured by DEC ($ million, 2011 prices)
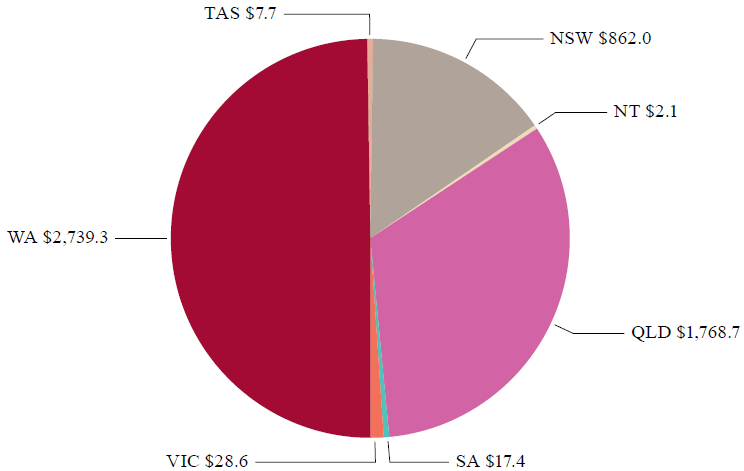
Source: ACIL Allen Consulting (2014a)
WA accounts for 51 per cent of national rail freight DEC. This is dominated by freight rail in the Pilbara which supports mining operations in the region. Queensland's share of national DEC in 2011 was 33 per cent, while in NSW the figure was 16 per cent. In both states, the majority of the DEC was generated by mining.
_________________________________________________________________________________
192. Bureau of Infrastructure, Transport and Regional Economics (2014b)
193. Bureau of Infrastructure, Transport and Regional Economics (2014b)