7.1.4.1 Existing capacity
The Audit estimated that the national container handling capacity of Australia's ports was 12 million twenty-foot equivalent units (TEU) in 2011. This was well in excess of the utilisation of ports across Australia, with 6.8 million TEU handled in 2011.204
This capacity limit includes a planning cap on Port Botany, which has subsequently been relaxed, providing scope for an additional four to five million TEU of handling capacity. The Port of Melbourne is currently making significant investments in its container handling capacity.
Australia's bulk ports in the Pilbara were estimated to have the capacity to export 483 million tonnes of iron ore in 2011. Since then there has been substantial investment to nearly double this capacity. Exports from Port Walcott, Port Dampier and Port Hedland were estimated at around 420 million tonnes in 2011, 87 per cent of estimated capacity at that time.
Coal ports in Queensland and NSW also contribute significantly to Australia's export volumes. In 2011, Newcastle, Gladstone, Hay Point and Dalrymple Bay, Brisbane, Abbot Point and Port Kembla exported a total of 286.2 million tonnes of coal.
In terms of total throughput, Australia's ports handled 973 million mass tonnes of cargo in 2011, with more than 90 per cent of this being exports. The Audit estimates that Australia's ports provide an aggregate capacity of 1,417 million tonnes.205
The DEC for Australia's port services in 2011 was estimated at $20.7 billion. This equates to approximately 1.6 per cent of GDP in 2011.
Figure 36 shows the share of value-add of port services in each of the states and territories in 2011, measured by DEC. This highlights the significant contribution of each of the four largest states, with NSW, WA, Victoria and Queensland accounting for 92.5 per cent of the share of national DEC between them.
Figure 36: Share of value-add for port infrastructure services by state and territory in 2011, measured by DEC
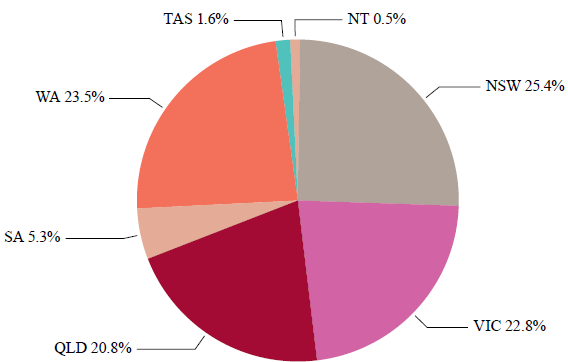
Source: ACIL Allen Consulting (2014a)
Despite the importance of ports as a supply chain link for commodity exports, non-bulk port services in each of the major cities accounted for the majority of national DEC for ports services. Port Botany in Sydney (22.5 per cent of national ports DEC), Port of Melbourne (21.6 per cent), Port of Brisbane (14.5 per cent) and Fremantle Ports (12.8 per cent) each accounted for considerable shares of their respective state's DEC.
_________________________________________________________________________________
204. ACIL Allen Consulting (2014a)
205. ACIL Allen Consulting (2014a)