7.2.1.1 Electricity
In the Audit, the electricity sector covers generation, transmission and distribution facilities.
Growth in electricity consumption has slowed across Australia in the recent few years, and declined in the eastern states. This marks a break in the historic relationship between rising electricity use and economic and population growth. Peak demand has held relatively stable.219 The decline in electricity demand was unexpected and driven by a range of factors, including loss of large industrial loads, rising energy efficiency standards, increased penetration of small-scale photovoltaic (PV) systems, a wide range of national and jurisdictional energy efficiency initiatives, such as the National Framework for Energy Efficiency,220 and consumer response to increases in retail prices. A delayed reaction to the fall in demand has arguably led to overinvestment in network capacity.221
The electricity sector is currently dealing with two major areas of ongoing policy reform, in renewable energy policy, and in the regulation of networks and retail electricity prices.
Despite recent stagnant demand, there are likely to be significant developments and investment in parts of the electricity supply sector in the future, in response to policy, technology and consumption changes, and associated with the replacement of existing equipment.
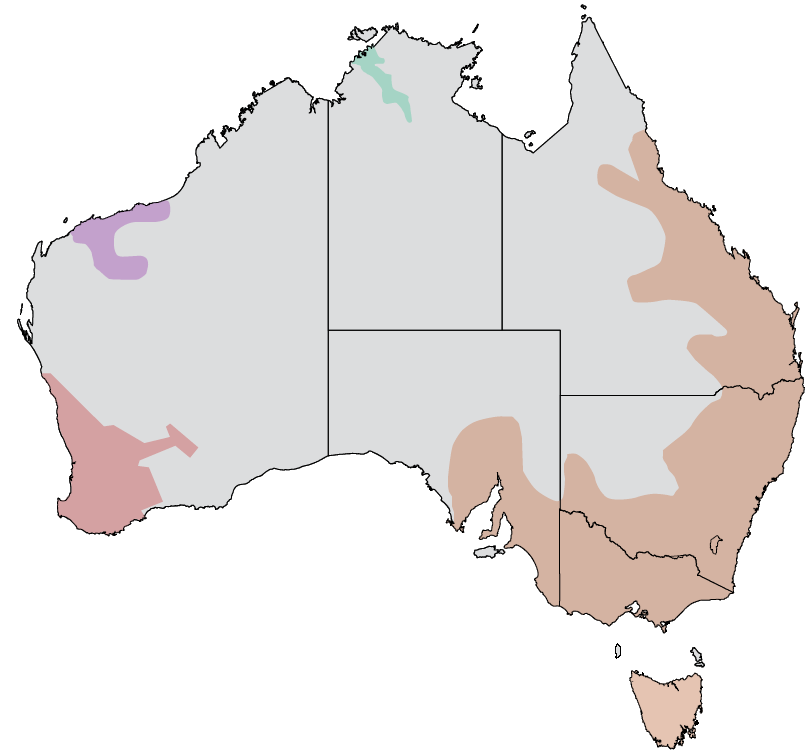
The National Energy Market (NEM), which services the eastern states and SA, and the South West Interconnected System (SWIS), which services south-west WA, are the two main electricity grids in Australia. Together they serve more than 20 million residents. The NT is primarily served by the Darwin-Katherine electricity network, and the Pilbara region is served by the North-West Interconnected System (NWIS). As show in Figure 40, there are areas without access to the major grids. These include remote communities and resource operations,222 which generally face higher costs to generate and distribute electricity.
Electricity supply is now determined on commercial terms throughout Australia. Electricity infrastructure is generally provided where the cost of supply can be brought into balance with prices that users and consumers are able to pay.
The Audit estimated the capacity, utilisation and DEC of electricity services infrastructure in 2011. The figures below are the sum totals across the different markets for that year:
■ installed capacity of generation facilities was estimated at 54 Gigawatts (GW);223
■ a total of 183,992 GWh (Gigawatt hours) of electricity were delivered to customers through national distribution networks;
■ the NEM had 49,110 MW of registered capacity, with peak summer demand of 34,933 MW and peak winter demand of 31,240 MW; and
■ the DEC of electricity infrastructure was $16 billion (in 2011 dollars), comprising $4.8 billion for generation, $3.6 billion for transmission and $7.6 billion for distribution.
Table 22 shows the DEC of electricity generation, transmission and distribution by state/territory in 2011. The audit region with the greatest DEC attributable to electricity infrastructure services in 2011 was greater Sydney (combined DEC of $2.4 billion), followed by greater Perth ($1.3 billion).
Figure 40: Australia's key electricity markets
| |
| |
| |
| Drawin-katherine |


Source: AECOM (2014)
Table 22: Electricity generation, transmission and distribution DEC by state/territory - 2011 (2011 prices)
State | Generation DEC | Transmission DEC | Distribution DEC |
| ($m) | ($m) | ($m) |
1,254 | 835 | 3,190 | |
1,240 | 434 | 1,400 | |
560 | 684 | 2,026 | |
194 | 246 | 550 | |
1,163 | 1,178 | - | |
393 | 204 | 227 | |
34 | - | 85 | |
- | 28 | 140 | |
Australia | 4,838 | 3,609 | 7,618 |
Source: ACIL Allen Consulting (2014a)
Historically, growth in electricity demand has outpaced that of the population and GDP. However, recent electricity demand growth has been below historic averages for both major grids.
An outright decline in demand has been a persistent trend in the eastern states. In 2009, the electricity networks sent out 195 TWh224 of operational energy across the NEM. This had fallen to 181.2 TWh by 2014 - a decline of seven per cent.225
The SWIS has seen a softening in demand growth in recent years. Average annual growth from 2011 to 2014 was around 1.4 per cent, significantly below historic rates.226
_________________________________________________________________________________
219. Australian Energy Market Operator (2014a) and Independent Market Operator (2014)
220. Council of Australian Governments (2008)
221. Department of Industry and Science (2014c), p. viii
222. Bureau of Resources and Energy Economics (2013)
223. GW = 1000 Megawatts (MW)
224. 1 TWh = 1000 GWh
225. Australian Energy Market Operator (2014a)
226. Independent Market Operator (2014)