7.4.1.1 Scale of infrastructure and services
The Audit reports on the infrastructure currently used in the provision of water and sewerage services to customers, including its capacity and utilisation, and the DEC of the services provided. This includes the infrastructure used for water storage, treatment and distribution, and for sewage collection and treatment.
Specifically, the Audit covers the following infrastructure:
■ dams (excluding those built exclusively to manage natural resources, such as on-farm dams and those regulating river flows);
■ transmission pipelines for water transfer between dams (excluding forms of irrigation infrastructure such as channel transmission);
■ water treatment facilities, including water, sewerage (including water recycling) and desalination;
■ pumping stations and pumping equipment; and
■ pipe distribution systems for water and sewage collection and drainage.
The Audit covers both urban and rural infrastructure. However, the National Water Commission (NWC) dataset underpinning the Audit does not cover water utilities serving less than 10,000 properties. This means that total utilisation and some capacity information is not complete for rural and some regional urban areas.
Table 28 illustrates the total national utilisation of water and sewerage services in 2011, including the total volume of water supplied, volume of sewage collected and the number of properties served by water and sewerage services.
Table 28: National utilisation of existing water and sewerage infrastructure - 2011
| Parameters | Volumes |
| Water supplied | 7,641 GL |
| Number of properties served - water | 8.5 million |
| Sewage collected | 1,931 GL |
| Number of properties served - sewerage | 7.8 million |
Source: ACIL Allen Consulting (2014a)
Table 29 presents some key figures regarding the capacity of existing water and sewerage infrastructure. It shows the total storage capacity, the volumes held in 2013 (data for 2011 was not available), the desalination capacity and the length of water and sewer mains for each state and territory.
Table 29: Capacity of existing water and sewerage infrastructure
|
| Dam capacity, 2013 | Dam water in storage, 2013 | Desalination capacity, 2013 | Length water mains, 2011 | Length sewer mains, 2011 |
|
| GL per year | GL per year | GL per year | km | km |
| 22,929 | 13,630 | 90 | 63,529 | 42,254 | |
| 14,441 | 9,703 | 150 | 75,269 | 35,623 | |
| 10,429 | 9,726 | 49 | 36,090 | 26,055 | |
| 2,257 | 2,002 | 100 | 10,357 | 7,700 | |
| 11,470 | 8,861 | 150 | 17,248 | 13,253 | |
| 22,141 | 14,283 | 0 | 6,186 | 4,535 | |
| 285 | 228 | 0 | 1,706 | 954 | |
| 158 | 56 | 0 | 3,134 | 3,134 | |
| Australia | 84,111 | 58,488 | 539 | 213,518 | 133,508 |
Source: ACIL Allen Consulting (2014a)
The regions with the largest DEC from water and sewerage infrastructure services were the large urban areas: greater Sydney ($1.8 billion), greater Melbourne ($1.4 billion), greater Perth ($1.2 billion), greater Brisbane ($1.2 billion) and greater Adelaide ($700 million).
Figure 43 shows that 65.7 per cent of water consumed in Australia is used in the agriculture, forestry and fishing sector, with agriculture accounting for the vast majority of this figure (64.7 per cent of total water consumption).
The water and sewerage industry itself consumes 12.2 per cent, largely due to losses as well as water consumed by water supply, sewerage and drainage services.
Figure 44 shows that, despite consuming only 9.4 per cent of water in Australia, households account for 57.4 per cent of expenditure on water. Conversely, the agriculture, forestry and fishing sectors account for only 4.2 per cent of the national total.
Figure 43: Australian consumption of water by industry and household - 2012-13
|
|
|
|
|
|
| |
|
| 65.7% | |
|
| 3.1% | |
|
| 2.7% | |
|
| 13.9% | |
|
| 5.3% | |
|
| 9.4% | |
|
|
| |
|
|
|
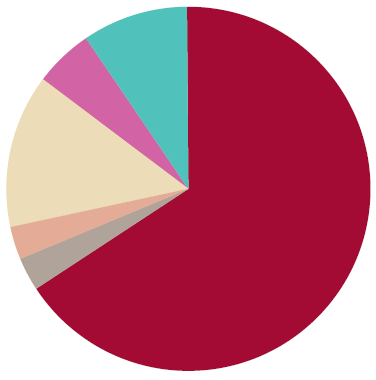
 Agriculture, forestry and fishing
 Mining
 Manufacturing
 Electricity, gas, water and waste
 Other industries
 Household
Source: Australian Bureau of Statistics (2014f)
Figure 44: Australian expenditure on water by industry and household - 2012-13
|
|
|
|
|
|
| |
|
| 4.2% | |
|
| 1.3% | |
|
| 5.0% | |
|
| 11.2% | |
|
| 20.9% | |
|
| 57.4% | |
|
|
| |
|
|
|
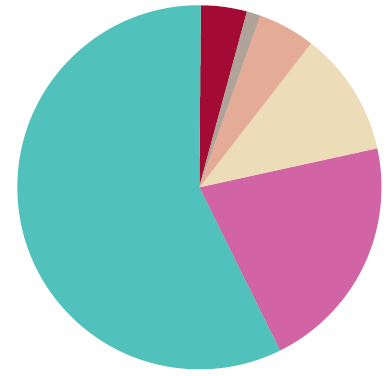
Source: Australian Bureau of Statistics (2014f)
The difference between consumption and expenditure in part reflects differences in the nature of the infrastructure required to deliver services to different sectors, with supplies of potable water to densely populated regions requiring more infrastructure for treatment and distribution. However, it also reflects the lower prices charged for rural water supply, largely as a result of past government policy settings.