7.4.1.2 Economic value of the sector
BITRE estimated the total value of Australia's water infrastructure assets at 30 June 2011 to be almost $140 billion.258 The Audit estimates the DEC of water and sewerage infrastructure services in 2011 was $10.6 billion (in 2011 dollars). This figure comprises the following components:
■ $5.8 billion for water infrastructure services; and
■ $4.8 billion for sewerage infrastructure services.259
Figure 45 provides the DEC for the water and sewerage services across each state and territory.
Figure 45: DEC for water and sewerage services in 2011 ($ million, 2011 prices)
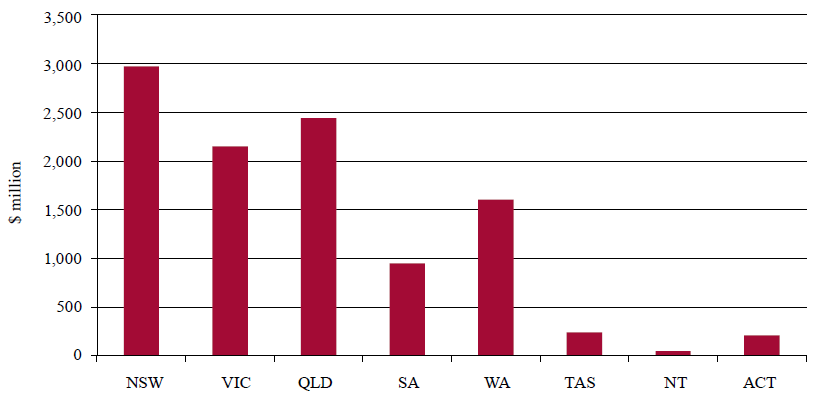
Source: ACIL Allen Consulting (2014a)
In 2011, total DEC was greatest in NSW, followed by Queensland and then Victoria. This follows from the number of properties serviced in each state and territory, as well as total length of water and sewer mains.
_________________________________________________________________________________
258. Bureau of Infrastructure, Transport and Regional Economics (2013a), p. 10
259. ACIL Allen Consulting (2014a)