1.2 Drivers of infrastructure demand - population and economy
As shown in Table 32, the NSW population is projected to reach 9.1 million by 2031 - an increase of 1.9 million people, or 26 per cent, from 2011. Medium level projections by the NSW Government suggest the state's population will grow slightly faster, to around 9.2 million in 2031.269 This is a little slower than projected national population growth of 37 per cent.
Gross State Product (GSP) is projected to increase to $734 billion by 2031 - an increase of 66 per cent from 2011. This is a little slower than projected national economic growth of 84 per cent.
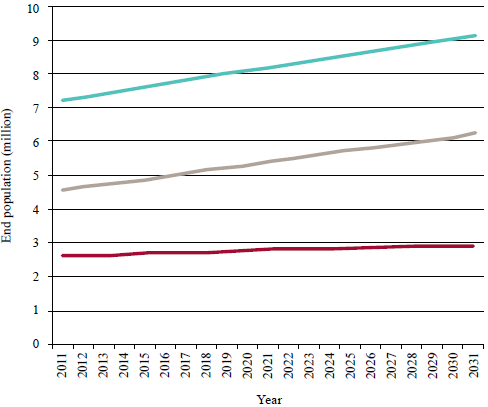
As shown in Figure 47, the ABS projects that Sydney will account for 1.6 million of the state's population increase from 2011 to 2031.
NSW Government projections for growth in greater Sydney are consistent with this figure, showing growth of 1.64 million, from 4.61 million people in 2011 to 6.25 million people in 2031.270
The NSW Government expects major growth in the inner city, the North West corridor (Baulkham Hills/Blacktown/Rouse Hill), the South West corridor (including Liverpool, Fairfield, Camden and Campbelltown), and Western Sydney (Parramatta to Blacktown).271
Table 32: Projected population and economic growth for New South Wales
| 2011 | % of National | 2031 | % of National | Increase % | |
| Population (persons) | 7,218,529 | 32.3% | 9,128,665 | 29.9% | 26% |
| Gross State Product ($m) | 441,249 | 31.4% | 733,723 | 28.4% | 66% |
Source: ACIL Allen Consulting (2014a)272
Figure 47: Population projections for New South Wales - 2011 to 2031
|
|
|
 Greater Sydney
 Balance of
  Total
Total Source: Australian Bureau of Statistics (2013c)273
___________________________________________________________________________________________________
269. New South Wales Department of Planning and Environment (2014)
270. To ensure consistency with the Australian Bureau of Statistics' definition of the Sydney Greater Capital City Statistical Area, the reference to the NSW population projections above covers what the government refers to as Sydney Metropolitan Local Government Areas (LGAs), as well as the Gosford and Wyong LGAs (2014)
271. New South Wales Government (2014)
272. Gross State Product is in 2010-11 prices.
273. Series B (medium level) projections.