1.3 Summary of New South Wales infrastructure from 2011 to 2031
In 2011, the DEC of infrastructure in NSW was $60 billion, which was 32.3 per cent of the national figure. By 2031, NSW infrastructure DEC is projected to increase by around $47 billion, or 78 per cent, to $108 billion. This would represent 29 per cent of national DEC. Figure 48 and Figure 49 highlight the spread of infrastructure's economic contribution across the 14 Audit regions in NSW for 2011 and 2031 respectively. Consistent with population growth, DEC growth is projected to be greatest in the Sydney region, increasing by 85 per cent from $43 billion to $80 billion during the period from 2011 to 2031.
Figure 48: Direct Economic Contribution of infrastructure in New South Wales, 2011
|
| |
|
| 1 Greater Sydney 2 Capital Region 3 Central West 4 Coffs Harbour - Grafton 5 Far West and Orana 6 Hunter Valley exc Newcastle 7 Illawarra 8 Mid North Coast 9 Murray 10 New England and North West 11 Newcastle and Lake Macquarie 12 Richmond - Tweed 13 Riverina 14 Southern Highlands and Shoalhaven |
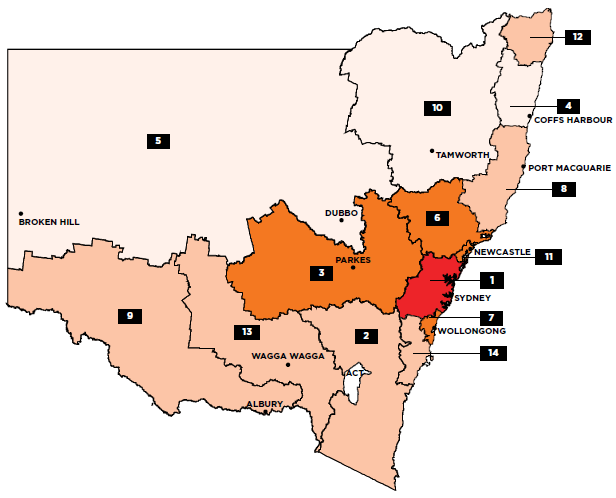
 <500
<500 500 - 1,000
 1,000 - 5,000
 5,000 - 10,000
 10,000 - 50,000
 >50,000
Source: ACIL Allen Consulting (2014a)

Figure 49: Projected Direct Economic Contribution of infrastructure in New South Wales, 2031
|
| |
|
| 1 Greater Sydney 2 Capital Region 3 Central West 4 Coffs Harbour - Grafton 5 Far West and Orana 6 Hunter Valley exc Newcastle 7 Illawarra 8 Mid North Coast 9 Murray 10 New England and North West 11 Newcastle and Lake Macquarie 12 Richmond - Tweed 13 Riverina 14 Southern Highlands and Shoalhaven |
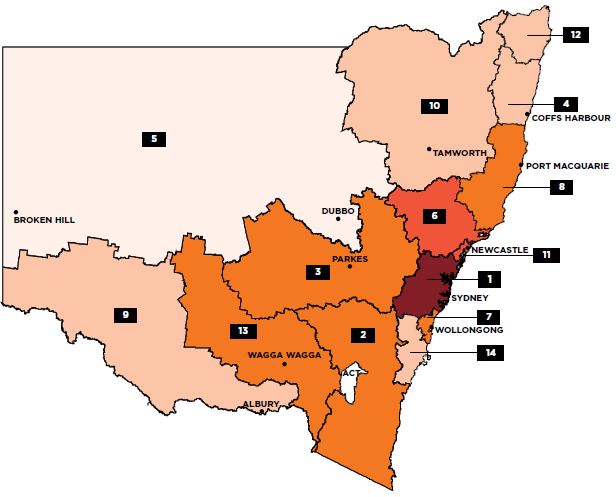
Source: ACIL Allen Consulting (2014a)
Table 33 provides a snapshot of NSW economic infrastructure across the four sectors of transport, water, energy and telecommunications. The table notes the capacity of each subsector in general terms and its rate of utilisation in 2011, along with historical (2011) and projected (2031) DEC for each subsector.
Table 33: Overview of New South Wales infrastructure
| Subsector | Capacity 2011 | Utilisation 2011 | DEC 2011 | Projected DEC 2031 | Projected % increase in DEC | |||||
| % of Nat. | % of Nat. | % of Nat. | % of Nat. | 2011-2031 | ||||||
| Transport | Urban Roads | 615,600,000 | 28% | 132,200,000 | 31% | $27,504m | 35% | $53,635m | 31% | 95% |
| Urban Public Transport | 129,800,000 | 49% | 29,200,000 | 43% | ||||||
| National Highways | 5,114 | 15% | 754,494 | 40% | $3,597m | 38% | $5,297m | 34% | 47% | |
| Freight Rail | n/a | n/a | n/a | n/a | $862m | 16% | $1,274m | 13% | 48% | |
| Ports | 237 | 17% | 157 | 15% | $5,261m | 25% | $8,416m | 20% | 60% | |
| 3.2 | 27% | 2.0 | 30% | |||||||
| Airports | 50 | 18% | 39,452,460 | 30% | $5,675m | 27% | $10,278m | 25% | 81% | |
| Energy | 16,654 | 31% | 67,611 | |||||||
| Electricity | 13,563 | 33% | 71,827 | 11% | $5,279m | 33% | $8,201m | 31% | 55% | |
| 12,291 | 33% | 61,797 | ||||||||
| Gas | n/a | n/a | 195.72 | 15% | $123m | 11% | $173m | 5% | 40% | |
| n/a | n/a | 105.23 | 31% | $353m | 29% | $495m | 33% | 40% | ||
| Petroleum product terminals | n/a | n/a | 17,591 | 22% | $239m | 22% | $338m | 20% | 41% | |
| Telecomm | 4.58 | n/a | 1,984 | n/a | $8,630m | 41% | $16,162m | 38% | 87% | |
| 2.35 | n/a | |||||||||
| Water & Sewerage | Water | 63,529 | 30% | 3,880,400 | 51% | |||||
| 13,630 | 23% | 2,625 Properties served - water ('000) | 31% | $2,971m | 28% | $3,403m | 21% | 15% | ||
| Sewerage | 90,000 | 17% | 710,726 | 37% | ||||||
| 42,254 | 32% | 2,495 | 32% | |||||||
Source: ACIL Allen Consulting (2014a)274
___________________________________________________________________________________________________
274. DEC figures in this table are rounded to the nearest $ million. Per cent changes may not tally exactly with rounded estimates. See Glossary for explanation of abbreviations and terms.