1.5.1.3 Road corridors in Sydney-Newcastle-Wollongong
The Audit dataset provides a broad range of data about corridors, and there are many ways of analysing this data. Given the focus of the Audit on economic indicators, the analysis in Table 34 and Table 35 focuses on delay cost. This applies a dollar cost to time delays, based on lost productivity, and takes account of the different costs applicable to different vehicle types.
Some users of the Audit dataset may prefer to use more traditional indicators of congestion, such as traffic V/C. This measure is included in Table 34 and Table 35, as is the DEC measure, which gives insight into the underlying value of activity on the corridor, and the proportion of DEC attributable to delay cost.
These measures are expressed per lane kilometre of road. This normalises the results to facilitate comparison across a wide range of corridor types - some very long, some consisting of multiple roads, and some relatively short single roads.
The modelling provides one method of measuring and projecting demand for transport infrastructure and the corridors identified in Table 34 and Table 35 reflect this approach. The NSW Government may have utilised other data, and different methods of analysis, to inform identification of infrastructure priorities. For further information on the assumptions, included projects and methodology applied in the model, refer to the supporting documentation by Veitch Lister Consulting.
Table 34 shows corridors ranked by delay cost per lane kilometre in 2011, with the equivalent projections for 2031 in Table 35. Taken together, these tables give an indication of which corridors warrant further study, and where interventions are likely to have the biggest economic return.
Table 34: Road corridors in Sydney-Newcastle-Wollongong 2011, by delay cost (>$1 million per lane km, 2011 dollars)
Rank | Road Corridor | State | Delay cost | DEC per lane | Volume Capacity |
1 | Pennant Hills Rd - Parramatta to Hornsby | 3.53 | 6.81 | 94% | |
2 | King Georges Rd Corridor Princes Hwy - M4 | 2.28 | 6.36 | 83% | |
3 | Chatswood to Narraweena via Warringah Rd | 2.18 | 5.54 | 77% | |
4 | Homebush Bay to Mona Vale Corridor (A3) | 1.92 | 4.66 | 76% | |
5 | Sutherland - Ryde/Parramatta Corridor (A6) | 1.77 | 4.55 | 77% | |
6 | Victoria Rd (A40) Corridor | 1.73 | 5.08 | 73% | |
7 | Parramatta Rd (M4) Corridor Ashfield - Strathfield | 1.64 | 4.47 | 84% | |
8 | Western Mwy (M4) Corridor Strathfield - Parramatta | 1.37 | 4.17 | 79% | |
9 | Parramatta Rd (A31) City West Link Corridor Sydney - Ashfield | 1.23 | 4.09 | 75% | |
10 | Nth Sydney - Northern Beaches Corridor | 1.22 | 3.47 | 63% | |
11 | M5/A34 Corridor | 1.19 | 4.37 | 73% | |
12 | Gore Hill/Warringah Fwys/SHB/ Eastern Dist | 1.15 | 5.37 | 72% | |
13 | Hume Hwy Corridor (A22) Lansdowne - Haberfield | 1.12 | 4.09 | 74% | |
14 | Cumberland Hwy (Hume Hwy-M4) | 1.06 | 3.21 | 76% | |
15 | NW Inner Corridor (M2/LCT) | 1.00 | 3.66 | 64% |
Source: Infrastructure Australia analysis of data from ACIL Allen Consulting (2014b) and Veitch Lister Consulting (2014b)
Table 35: Road corridors in Sydney-Newcastle-Wollongong 2031, by projected delay cost (>$1.75 million per lane km, 2011 dollars)
Rank | Road Corridor | State | Delay cost | DEC per lane | Volume Capacity |
1 | Gore Hill/Warringah Fwys/SHB/ Eastern Dist | 6.74 | 13.35 | 87% | |
2 | Chatswood to Narraweena via Warringah Rd | 6.16 | 11.16 | 89% | |
3 | King Georges Rd Corridor Princes Hwy - M4 | 5.60 | 11.45 | 94% | |
4 | Pennant Hills Rd - Parramatta to Hornsby | 5.14 | 9.19 | 96% | |
5 | Parramatta Rd (A31) City West Link Corridor Sydney - Ashfield | 4.79 | 9.23 | 91% | |
6 | Sutherland - Ryde/Parramatta Corridor (A6) | 4.76 | 8.89 | 90% | |
7 | Victoria Rd (A40) Corridor | 4.69 | 9.68 | 85% | |
8 | Homebush Bay to Mona Vale Corridor (A3) | 4.48 | 8.41 | 88% | |
9 | Airport to CBD | 3.75 | 7.93 | 89% | |
10 | M5/A34 Corridor | 3.24 | 8.61 | 78% | |
11 | Nth Sydney - Northern Beaches Corridor | 3.03 | 6.35 | 73% | |
12 | NW Middle Corridor (M7/M2) | 2.99 | 7.19 | 85% | |
13 | Cumberland Hwy (Hume Hwy-M4) | 2.79 | 6.00 | 89% | |
14 | Hume Hwy Corridor (A22) Lansdowne - Haberfield | 2.64 | 6.97 | 84% | |
15 | Western Mwy (M4) Corridor Strathfield - Parramatta | 2.41 | 6.50 | 79% | |
16 | Little Bay to CBD East | 2.15 | 5.35 | 63% | |
17 | NW Inner Corridor (M2/LCT) | 2.10 | 6.49 | 72% | |
18 | Cronulla to Kogarah | 2.09 | 4.92 | 79% | |
19 | The Horsley Drive Corridor | 1.81 | 4.77 | 82% | |
20 | Western Mwy (M4) Corridor Parramatta - M7 | 1.76 | 5.18 | 78% |
Source: Infrastructure Australia analysis of data from ACIL Allen Consulting (2014b) and Veitch Lister Consulting (2014b)
Figure 51 and Figure 52 show projected road congestion, by V/C, in 2031 for the AM peak hour and daytime inter-peak periods respectively. These show the corridors and locations likely to reach or exceed maximum capacity by 2031, in the absence of any additional capacity.
During the AM peak hour a large part of the network shows significant congestion. In the inter-peak period there is surplus capacity across most of the network, except for key crossings over Sydney Harbour, Parramatta River, Middle Harbour and Georges River, access to the inner city, and access to the terminals at Sydney Airport. This suggests some scope for demand management to spread peak period transport flows.
Figure 51: Sydney road network volume/capacity ratio in 2031 - AM maximum peak hour
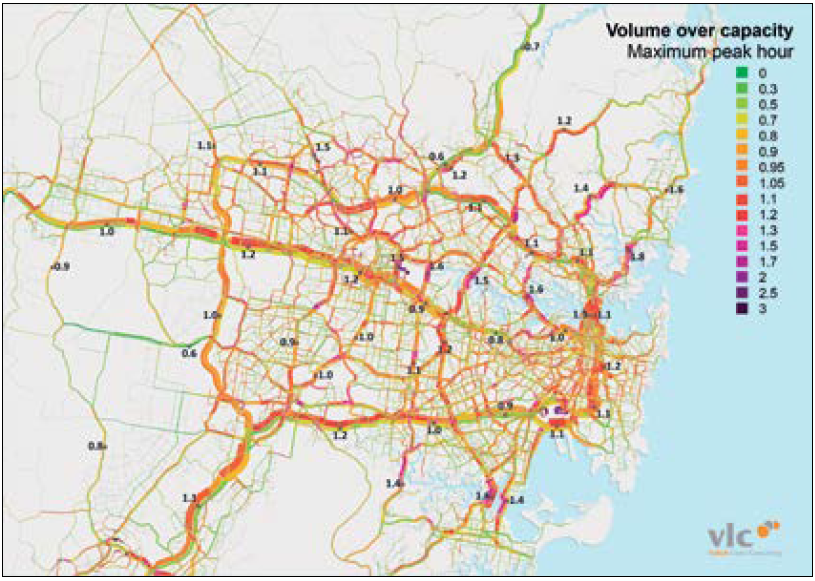
Source: Veitch Lister Consulting (2014b)
Figure 52: Sydney road network volume/capacity ratio in 2031 - daytime inter-peak period
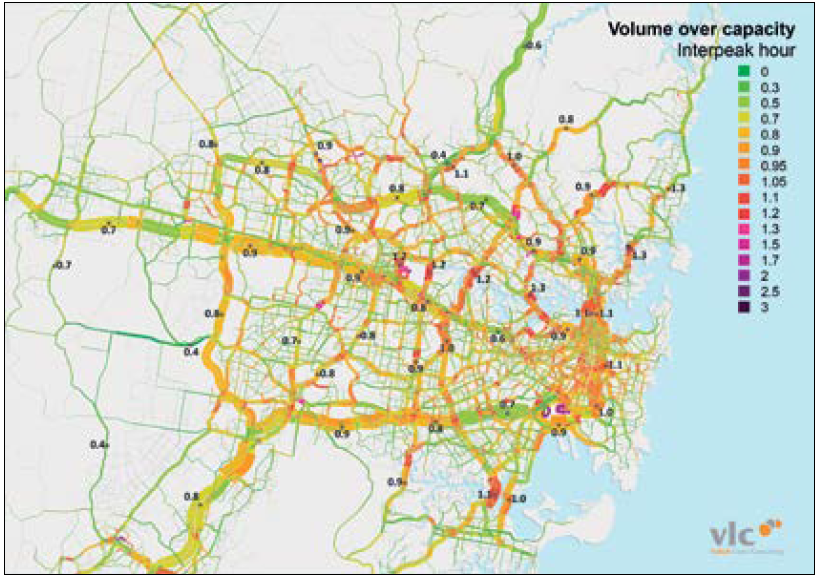
Source: Veitch Lister Consulting (2014b)
Figure 53: Top 10 Sydney origin/destination pairs by passenger hours travelled for public transport
| ■ Rail ■ Bus ■ Light rail ■ Ferry |
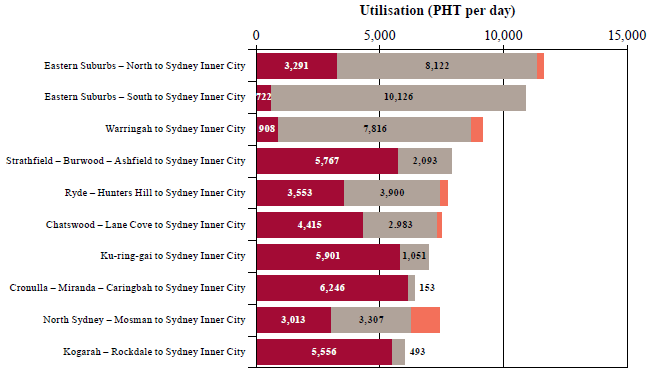
Source: Infrastructure Australia analysis of data from Veitch Lister Consulting (2014b)