2.3 Summary of Victoria's infrastructure from 2011 to 2031
In 2011, the DEC of infrastructure in Victoria was $43 billion, which was 23 per cent of the national figure. In 2031, Victoria's infrastructure DEC is projected to increase by around $38 billion, or 90 per cent, reaching $81 billion, which would be around 22 per cent of the national figure.
Figure 59 and Figure 60 show the spread of infrastructure DEC across the nine Audit regions in Victoria. Growth is highest in the Melbourne region, where DEC is projected to grow by 96 per cent.
Figure 59: Victoria regional DEC 2011
|
| |
|
| 1 Greater Melbourne 2 Ballarat 3 Bendigo 4 Geelong 5 Hume 6 Latrobe - Gippsland 7 North West 8 Shepparton 9 Warrnambool and South West |
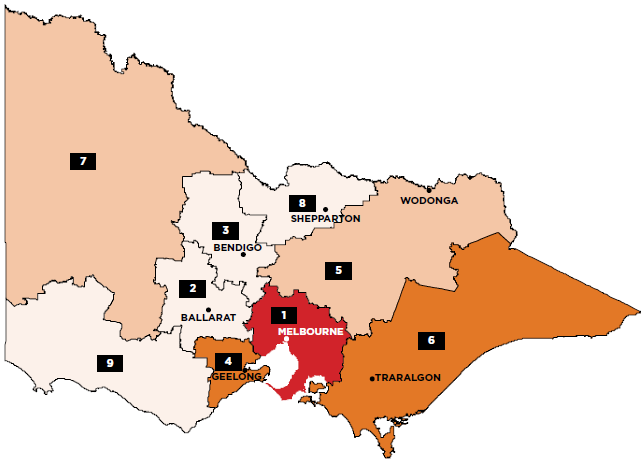
 <500
<500 500 - 1,000
 1,000 - 5,000
 5,000 - 10,000
 10,000 - 50,000
 >50,000
Source: ACIL Allen Consulting (2014a)
Figure 60: Victoria regional DEC 2031
|
| |
|
| 1 Greater Melbourne 2 Ballarat 3 Bendigo 4 Geelong 5 Hume 6 Latrobe - Gippsland 7 North West 8 Shepparton 9 Warrnambool and South West |
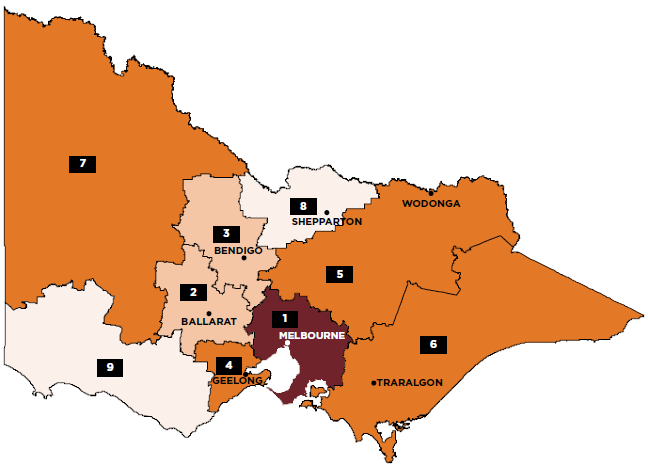
Source: ACIL Allen Consulting (2014a)
Table 43 provides a snapshot of Victoria's economic infrastructure across the four sectors of transport, energy, communications and water. The table notes the capacity of each subsector in general terms and its rate of utilisation in 2011, along with historical (2011) and projected (2031) DEC for each subsector.
Table 43: Overview of Victorian infrastructure
| Subsector | Capacity 2011 | Utilisation 2011 | DEC 2011 | DEC 2031 | Projected % increase in DEC | |||||
| % of Nat. | % of Nat. | % of Nat. | % of Nat. | 2011-2031 | ||||||
| Transport | Urban Roads | 608,100,000 | 27% | 116,100,000 | 28% | $20,008m | 26% | $40,796m | 23% | 104% |
| Urban Public Transport | 72,200,000
| 27% | 24,000,000 | 36% | ||||||
| National Highways | 4,062 | 12% | 497,600 | 27% | $1,492m | 16% | $2,249m | 14% | 51% | |
| Freight Rail | n/a | n/a | n/a | n/a | $29m | 1% | $39m | <1% | 36% | |
| Ports | 74 | 5% | 40 | 4% | $4,718m | 23% | $8,162m | 19% | 73% | |
| 3.7 | 21% | 2.4 | 35% | |||||||
| Airports | 42 | 15% | 28,200,561 | 21% | $4,061m | 20% | $8,064m | 20% | 99% | |
| Energy | 10,765 | 20% | 55,050 | |||||||
| Electricity | 9,982 | 24% | 52,352 | 9% | $3,074m | 19% | $4,709m | 18% | 53% | |
| 8,836 | 24% | 43,319 | ||||||||
| Gas | n/a | n/a | 310.07 | 23% | $144m | 13% | $159m | 5% | 10% | |
| n/a | n/a | 161.60 | 47% | $483m | 40% | $532m | 35% | 10% | ||
| Petroleum product terminals | n/a | n/a | 20,727 | 26% | $282m | 26% | $421m | 24% | 49% | |
| Telecomm | 4.60 | n/a | 1,539 | n/a | $6,220m | 30% | $12,641m | 30% | 103% | |
| 1.78 | n/a | Total households with broadband internet access at home ('000) | ||||||||
| Water & Sewerage | Water | 75,269 | 35% | 1,999,242 | 26% | |||||
| 9,703 | 17% | 2,432 Properties served - water ('000) | 28% | $2,150m | 20% | $3,252m | 20% | 51% | ||
| Sewerage | 150,000 | 28% | 498,112 | 26% | ||||||
| 35,623 | 27% | 2,190 | 28% | |||||||
Source: ACIL Allen Consulting (2014a)309
___________________________________________________________________________________________________
309. DEC figures are rounded to the nearest $ million, so percentage changes may not tally exactly with rounded estimates in this table. See Glossary for explanation of abbreviations and terms.