2.5.1.3 Road corridors in Melbourne-Geelong
The Audit dataset provides a broad range of data about corridors, and there are many ways of analysing this data. Given the focus of the Audit on economic indicators, the analysis in Table 44 and Table 45 focuses on delay cost. This applies a dollar cost to time delays, based on lost productivity, and takes account of the different costs applicable to different vehicle types.
Some users of the Audit dataset may prefer to use more traditional indicators of congestion, such as traffic volume compared to capacity (V/C). This measure is included in Table 44 and Table 45, as is the DEC measure, which gives insight into the underlying value of activity on the corridor, and the proportion of DEC attributable to delay cost.
These measures are expressed per lane kilometre of road. This normalises the results to facilitate comparison across a wide range of different corridor types - some very long, some consisting of multiple roads, and some relatively short single roads.
The modelling provides one method of measuring and projecting demand for transport infrastructure and the corridors identified in Table 44 and Table 45 reflect this approach. The Victorian Government may have utilised other data, and different methods of analysis, to inform identification of infrastructure priorities. For further information on the assumptions, included projects and methodology applied in the model, refer to the supporting documentation by Veitch Lister Consulting.
Following the decision of the Victorian Government not to proceed with the East West Link, neither Stage 1 nor Stage 2 of this project was included in the modelling. The modelling also does not incorporate the widening of CityLink and the Tullamarine Freeway. The decision to proceed with funding for the project was made after the modelling was conducted.
Table 44 shows corridors ranked by delay cost per lane kilometre in 2011, with the equivalent projections for 2031 in Table 45. Taken together, these tables give an indication of which corridors warrant further study, and where interventions are likely to have the biggest economic return.
Table 44: Top 10 road corridors in Melbourne-Geelong 2011, by delay cost (2011 dollars)
| Rank | Road Corridor | State | Delay cost by | DEC per lane | Volume Capacity |
| 1 | City Link-Eastern Fwy connection north of CBD | VIC | 1.56 | 5.49 | 70% |
| 2 | Eastern Fwy Corridor to Ringwood | VIC | 1.29 | 5.77 | 76% |
| 3 | Western/Metropolitan Ring Road | VIC | 1.13 | 5.52 | 76% |
| 4 | West Gate/Princes Freeway Corridor | VIC | 0.94 | 4.43 | 51% |
| 5 | City Link Western Link | VIC | 0.75 | 5.02 | 62% |
| 6 | Monash/Princes Fwy Corridor | VIC | 0.73 | 4.07 | 61% |
| 7 | North-South Arterial - Northern Suburbs (St Georges Rd/High St) | VIC | 0.71 | 3.20 | 63% |
| 8 | Tullamarine Freeway (Airport) Corridor | VIC | 0.61 | 3.14 | 64% |
| 9 | North-South Arterials - Eastern Suburbs | VIC | 0.61 | 3.04 | 61% |
| 10 | Geelong Rd Corridor | VIC | 0.56 | 3.33 | 57% |
Source: Infrastructure Australia analysis of data from ACIL Allen Consulting (2014b) and Veitch Lister Consulting (2014c)
Table 45: Top 10 road corridors in Melbourne-Geelong 2031, by projected delay cost (2011 dollars)
| Rank | Road Corridor | State | Delay cost by | DEC per lane | Volume Capacity |
| 1 | Hume Freeway Corridor | VIC | 4.73 | 10.24 | 76% |
| 2 | Western/Metropolitan Ring Road | VIC | 3.91 | 11.83 | 85% |
| 3 | Tullamarine Freeway (Airport) Corridor | VIC | 3.52 | 7.67 | 81% |
| 4 | West Gate/Princes Freeway Corridor | VIC | 3.17 | 9.26 | 67% |
| 5 | City Link-Eastern Fwy connection north of CBD | VIC | 3.06 | 8.70 | 77% |
| 6 | Calder Freeway Corridor | VIC | 2.55 | 6.47 | 69% |
| 7 | Sydney Rd Corridor | VIC | 2.51 | 6.70 | 75% |
| 8 | Western Freeway Corridor | VIC | 2.42 | 6.08 | 62% |
| 9 | Monash/Princes Fwy Corridor | VIC | 2.39 | 7.69 | 72% |
| 10 | Eastern Fwy Corridor to Ringwood | VIC | 2.29 | 8.39 | 80% |
Source: Infrastructure Australia analysis of data from ACIL Allen Consulting (2014b) and Veitch Lister Consulting (2014c)
Figure 62 and Figure 63 show projected road congestion, by V/C, in 2031 for the AM peak hour and daytime inter-peak periods, respectively. These show the corridors and locations likely to reach or exceed maximum capacity by 2031, in the absence of any additional capacity. Note that in the inter-peak period there is surplus capacity across most of the network, except for access to Melbourne Airport, and access to some outer urban areas.
Figure 62: Melbourne road network volume/capacity ratio in 2031 - AM maximum peak hour
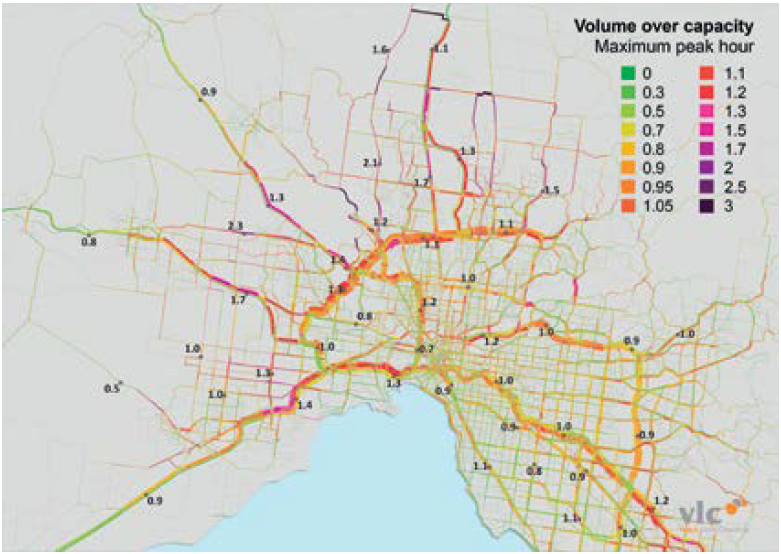
Source: Veitch Lister Consulting (2014c)
Figure 63: Melbourne road network volume/capacity ratio in 2031 - daytime inter-peak period
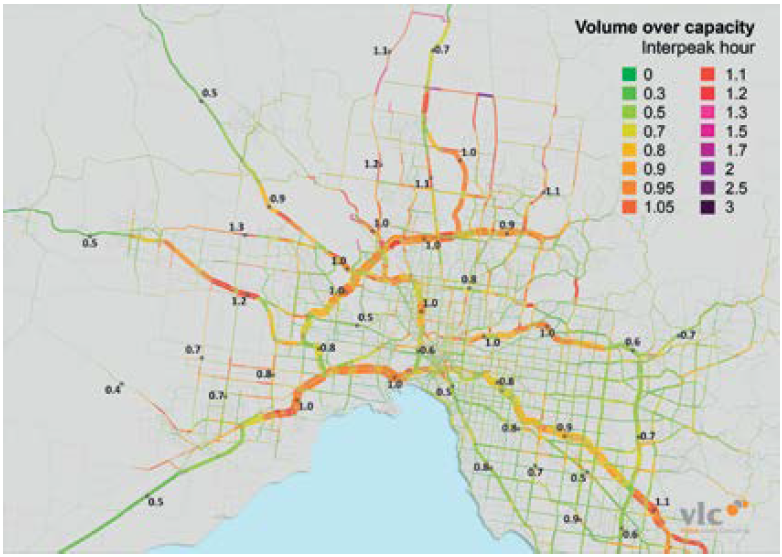
Source: Veitch Lister Consulting (2014c)