3.3 Summary of Queensland infrastructure from 2011 to 2031
In 2011, the DEC of infrastructure in Queensland was $36 billion, which was 19 per cent of the national figure. In 2031, Queensland infrastructure DEC is projected to increase by around $39 billion, or 107 per cent, reaching $74.6 billion (20 per cent of national DEC).
Figure 71 and Figure 72 highlight the spread of infrastructure's economic contribution across the Audit regions in Queensland for 2011 and 2031 respectively. DEC growth is expected to be fastest in South East Queensland and relatively high in Gladstone-Biloela (due to Liquefied Natural Gas development, agriculture and mining).
Figure 71: Queensland Regional DEC 2011
|
| |
|
| 1 Greater Brisbane 2 Cairns N+S 3 Cairns Hinterland 4 Darling Downs - Maranoa 5 Far North 6 Outback-North 7 SWQld_NA 8 SWQld 9 Sunshine Coast 10 Central Highlands (Qld) 11 Gladstone - Biloela 12 Gladstone - Biloela_NA 13 Rockhampton 14 Gold Coast 15 Bowen Basin - North 16 Mackay 17 Whitsunday 18 Toowoomba 19 Charters Towers - Ayr - Ingham 20 Townsville 21 Bundaberg 22 Wide Bay 23 Hervey Bay |
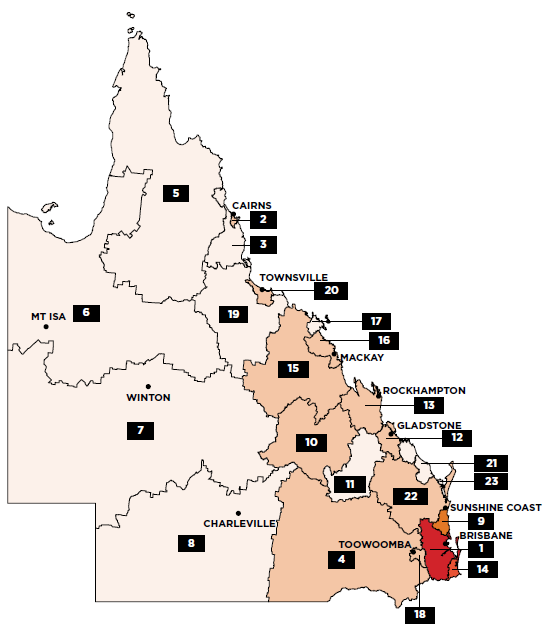
 <500
<500 500 - 1,000
 1,000 - 2,000
 2,000 - 10,000
 10,000 - 25,000
 >25,000
Source: ACIL Allen Consulting (2014a)
Figure 72: Queensland Regional DEC 2031
|
| |
|
| 1 Greater Brisbane 2 Cairns N+S 3 Cairns Hinterland 4 Darling Downs - Maranoa 5 Far North 6 Outback-North 7 SWQld_NA 8 SWQld 9 Sunshine Coast 10 Central Highlands (Qld) 11 Gladstone - Biloela 12 Gladstone - Biloela_NA 13 Rockhampton 14 Gold Coast 15 Bowen Basin - North 16 Mackay 17 Whitsunday 18 Toowoomba 19 Charters Towers - Ayr - Ingham 20 Townsville 21 Bundaberg 22 Wide Bay 23 Hervey Bay |
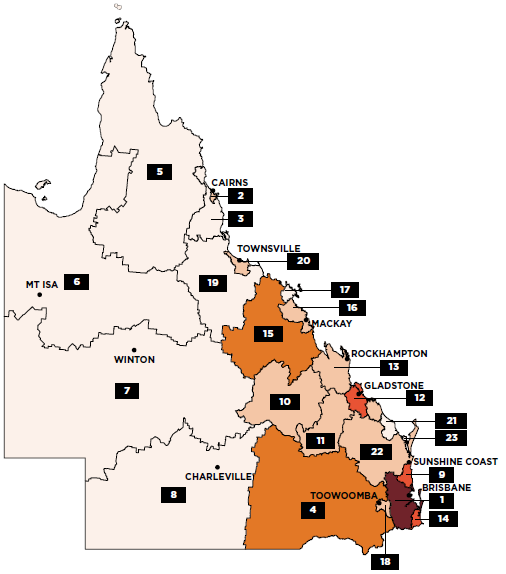
Source: ACIL Allen Consulting (2014a)
Table 53 provides a snapshot of Queensland's economic infrastructure across the four sectors of transport, water, energy and communications. The table notes the capacity of each subsector and its rate of utilisation in 2011, along with historical (2011) and projected (2031) DEC for each subsector.
Table 53: Overview of Queensland infrastructure
| Subsector | Capacity 2011 | Utilisation 2011 | DEC 2011 | DEC 2031 | Projected % increase in DEC | |||||
| % of Nat. | % of Nat. | % of Nat. | % of Nat. | 2011-2031 | ||||||
| Transport | Urban Roads | 457,400,000 | 20% | 83,700,000 | 20% | $13,075m | 17% | $31,111m | 18% | 138% |
| Urban Public Transport | 29,700,000 | 11% | 7,600,000 | 11% | ||||||
| National Highways | 6,838 | 20% | 360,800 | 19% | $2,391m | 25% | $4,471m | 29% | 87% | |
| Freight Rail | n/a | n/a | n/a | n/a | $1,769m | 33% | $2,615m | 28% | 48% | |
| Ports | 405 | 29% | 259 | 25% | $4,287m | 21% | $7,743m | 18% | 81% | |
| 2.5 | 21% | 1.0 | 15% | |||||||
| Airports | 92 | 34% | 35,619,474 | 27% | $5,430m | 26% | $10,940m | 27% | 101% | |
| Energy | 12,644 | 23% | 59,603 | |||||||
| Electricity | 8,109 | 20% | 47,341 | 9% | $3,270m | 20% | $5,147m | 20% | 57% | |
| 6,993 | 19% | 38,540 | ||||||||
| Gas | n/a | n/a | 265.30 | 20% | $214m | 19% | $1,872m | 59% | 776% | |
| n/a | n/a | 18.15 | 5% | $69m | 6% | $87m | 6% | 25% | ||
| Petroleum product terminals | n/a | n/a | 21,211 | 27% | $288m | 27% | $478m | 28% | 66% | |
| Telecomm | 4.50 | n/a | 1,256 | n/a | $2,763m | 13% | $6,040m | 14% | 119% | |
| 1.55 | n/a | Total households with broadband internet access at home ('000) | ||||||||
| Water & Sewerage | Water | 36,090 | 17% | 954,523 | 12% | |||||
| 9,726 | 17% | 1,482 | 17% | $2,439m | 23% | $4,062m | 25% | 67% | ||
| Sewerage | 49,000 | 9% | 372,107 | 19% | ||||||
| 26,055 | 20% | 1,344 | 17% | |||||||
Source: ACIL Allen Consulting (2014a)356
___________________________________________________________________________________________________
356. DEC figures are rounded to the nearest $ million, so percentage changes may not tally exactly with rounded estimates in this table. See Glossary for explanation of abbreviations and terms.