3.6.1.2 Origin/destination analysis of trips in Brisbane-Gold Coast-Sunshine Coast
Figure 73 shows trips in Brisbane-Gold Coast-Sunshine Coast by origin/destination (O/D), across road and public transport modes, in terms of DEC for 2011 and projected DEC for 2031. The O/D regions used here are SA3 regions as defined by ABS.359
The analysis shows that Inner Brisbane is the largest O/D for trips in the region and is projected to remain so. Between 2011 and 2031, some of the highest growth is forecast in the outer suburbs of Brisbane, with Jimboomba, Ipswich/Springfield-Redbank and Beaudesert all projected to increase at least four-fold.
Figure 73: Trips in Brisbane-Gold Coast-Sunshine Coast by origin/destination for roads and public transport in 2011 and 2031, measured by DEC ($ million)
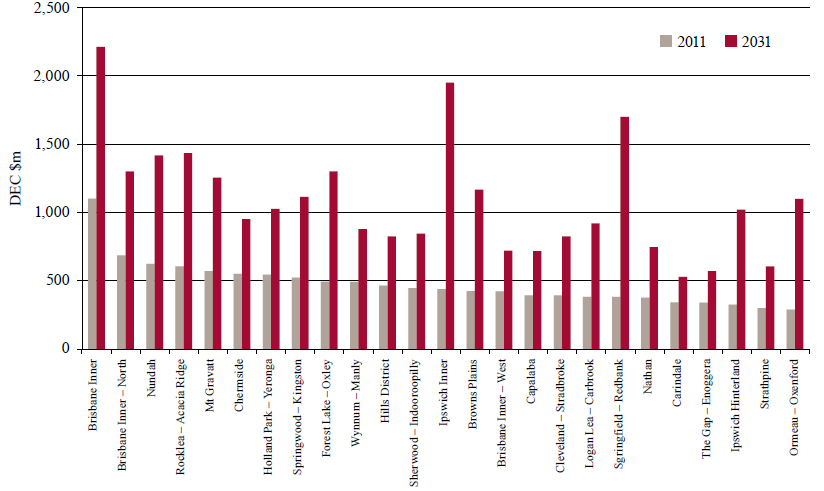
Source: Infrastructure Australia analysis of modelling data from Veitch Lister Consulting (2014d) and ACIL Allen Consulting (2014b)
___________________________________________________________________________________________________
359. SA3s provide a standardised regional breakup of Australia and generally (although not always) have populations between 30,000 and 130,000 persons.