3.6.1.3 Road corridors in Brisbane-Gold Coast-Sunshine Coast
The Audit dataset provides a broad range of data about corridors, and there are many ways of analysing this data. Given the focus of the Audit on economic indicators, the analysis in Table 54 and Table 55 focuses on delay cost. This applies a dollar cost to time delays, based on lost productivity, and takes account of the different costs applicable to different vehicle types.
Some users of the Audit dataset may prefer to use more traditional indicators of congestion, such as traffic V/C. This measure is included in Table 54 and Table 55, as is the DEC measure, which gives insight into the underlying value of activity on the corridor, and the proportion of DEC attributable to delay cost.
These measures are expressed per lane kilometre of road. This normalises the results to facilitate comparison across a wide range of different corridor types - some very long, some consisting of multiple roads, and some relatively short single roads.
The modelling provides one method of measuring and projecting demand for transport infrastructure and the corridors identified in Table 54 and Table 55 reflect this approach. The Queensland Government may have utilised other data, and different methods of analysis, to inform identification of infrastructure priorities. For further information on the assumptions, included projects and methodology applied in the model, refer to the supporting documentation by Veitch Lister Consulting.
Table 54 shows corridors ranked by net DEC per lane kilometre in 2011, with the equivalent projections for 2031 in Table 55. Taken together, these tables give an indication of which corridors warrant further study, and where interventions are likely to have the biggest economic return.
Table 54: Top 10 road corridors in Brisbane-Gold Coast-Sunshine Coast 2011, by delay cost (2011 dollars)
| Rank | Road Corridor | State | Delay cost by | DEC per lane | Volume Capacity |
| 1 | Indooroopilly - City | QLD | 1.45 | 3.62 | 86% |
| 2 | Ipswich Mwy | QLD | 1.14 | 4.26 | 66% |
| 3 | Inner City | North - South | QLD | 0.86 | 4.23 | 63% |
| 4 | City - Brisbane North | QLD | 0.84 | 2.79 | 74% |
| 5 | Ipswich Mwy - Indooroopilly | QLD | 0.73 | 2.34 | 79% |
| 6 | Logan River - Gateway Mwy | QLD | 0.61 | 3.02 | 66% |
| 7 | Inner City | East - West | QLD | 0.61 | 3.20 | 63% |
| 8 | Southport - Burleigh Heads | QLD | 0.60 | 2.96 | 66% |
| 9 | Pacific Mwy | City - Beenleigh | QLD | 0.53 | 2.46 | 76% |
| 10 | Redland | East - West | QLD | 0.51 | 1.77 | 71% |
Source: Infrastructure Australia analysis of data from ACIL Allen Consulting (2014b) and Veitch Lister Consulting (2014d)
Table 55: Road corridors in Brisbane-Gold Coast-Sunshine Coast 2031, by projected delay cost (>$1.75 million per land km, 2011 dollars)
| Rank | Road Corridor | State | Delay cost by | DEC per lane | Volume Capacity |
| 1 | Ipswich Mwy | QLD | 3.74 | 8.98 | 84% |
| 2 | Ipswich - Wacol | QLD | 3.56 | 6.70 | 94% |
| 3 | Pacific Mwy | Beenleigh - Helensvale | QLD | 3.48 | 7.32 | 98% |
| 4 | Ipswich Mwy - Indooroopilly | QLD | 3.28 | 5.92 | 93% |
| 5 | Pacific Mwy | City - Beenleigh | QLD | 2.64 | 6.11 | 88% |
| 6 | Logan River - Gateway Mwy | QLD | 2.57 | 7.00 | 84% |
| 7 | Helensvale - Southport | QLD | 2.45 | 6.51 | 84% |
| 8 | Inner City | North - South | QLD | 2.24 | 7.53 | 78% |
| 9 | Indooroopilly - City | QLD | 2.23 | 6.40 | 64% |
| 10 | Southport - Burleigh Heads | QLD | 2.19 | 6.03 | 83% |
| 11 | City - Brisbane North | QLD | 1.88 | 5.51 | 77% |
| 12 | City - Airport | QLD | 1.81 | 5.36 | 65% |
Source: Infrastructure Australia analysis of data from ACIL Allen Consulting (2014b) and Veitch Lister Consulting (2014d)
Congestion levels and delay costs are projected to worsen significantly to 2031, with Queensland set to experience the second highest level of population and employment growth in Australia, after WA. The outer areas (such as Jimboomba, Ipswich, Springfield-Redbank, Beaudesert, Ormeau Oxenford and Ipswich Hinterland) will have the highest growth rates.
Figure 74 and Figure 75 show projected road congestion, by V/C, in 2031 for the AM peak hour and daytime inter-peak periods respectively. These show the corridors and locations likely to reach or exceed maximum capacity by 2031, in the absence of any additional capacity. In the inter-peak period there is surplus capacity across most of the network, except for key crossings over the Brisbane River and on some corridors approaching the CBD, as well as certain stretches of the Pacific Motorway and the M2 towards Ipswich.
Figure 74: SEQ road network volume/capacity ratio in 2031 - AM maximum peak hour
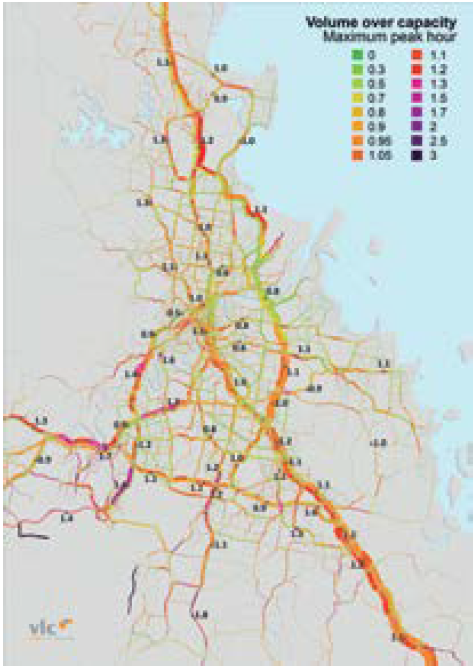
Source: Veitch Lister Consulting (2014d)
Figure 75: SEQ road network volume/capacity ratio in 2031 - daytime inter-peak period
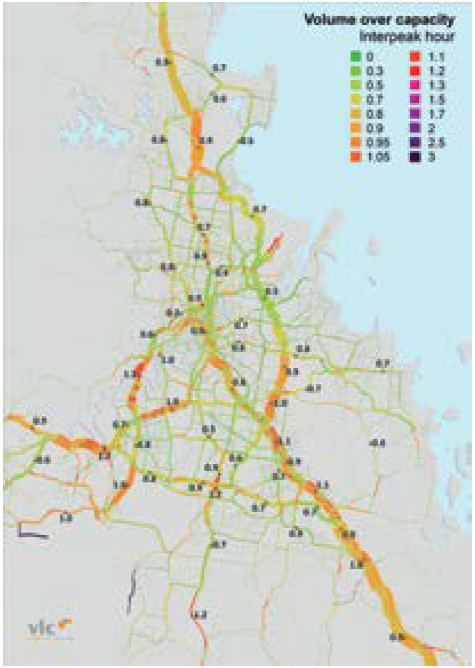
Source: Veitch Lister Consulting (2014d)