4.3 Summary of Western Australian infrastructure from 2011 to 2031
In 2011, the DEC of infrastructure in WA was $25.5 billion, which was 14 per cent of the national figure. By 2031, WA's infrastructure DEC is projected to increase by around $49 billion, or 192 per cent, reaching $74.2 billion (20 per cent of national DEC).
Figure 80 and Figure 81 show the spread of infrastructure's DEC across the 13 Audit regions in WA in 2011 and 2031 respectively. Growth will be fastest in the greater Perth region, where DEC is projected to grow by 208 per cent from $18 billion to $54 billion during the period, and in the Pilbara region, where DEC is projected to grow by 187 per cent from $5 billion in 2011 to $15 billion in 2031.
Figure 80: Western Australia Regional DEC 2011
|
| ||
|
| <100 | 1 Greater Perth |
|
| 100 - 500 | |
|
| 500 - 1,000 | |
|
| 1,000 - 10,000 | |
|
| 10,000 - 50,000 | |
|
| >50,000 | |
|
|
| |
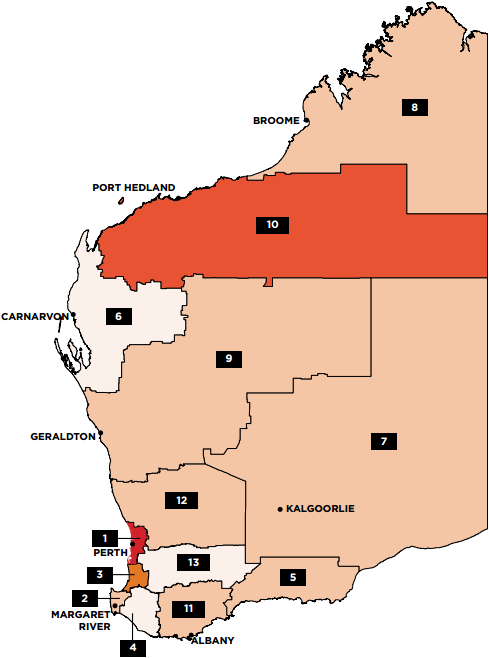


Source: ACIL Allen Consulting (2014a)
Figure 81: Western Australia Regional DEC 2031
|
| ||
|
| <100 | 1 Greater Perth |
|
| 100 - 500 | |
|
| 500 - 1,000 | |
|
| 1,000 - 10,000 | |
|
| 10,000 - 50,000 | |
|
| >50,000 | |
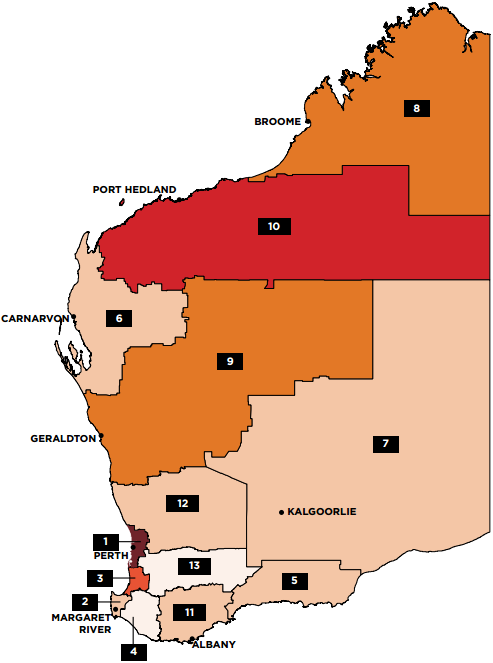
Source: ACIL Allen Consulting (2014a)
Table 62 provides a snapshot of WA's economic infrastructure across the four sectors of transport, water, energy and communications. The table notes the capacity of each subsector and its rate of utilisation in 2011, along with historical (2011) and projected (2031) DEC for each subsector.
Table 62: Overview of Western Australian infrastructure
|
| Subsector | Capacity 2011 | Utilisation 2011 | DEC 2011 | DEC 2031 | Projected % increase in DEC | |||||
|
|
|
| % of Nat. |
| % of Nat. |
| % of Nat. |
| % of Nat. | 2011-2031 | |
| Transport | Urban | 300,000,000 | 13% | 49,800,000 | 12% | $9,134m | 12% | $33,619m | 19% | 268% | |
| Urban | 17,700,000
| 7% | 4,300,000 | 6% | |||||||
| National Highways | 9,946 | 29% | 46,157 | 2% | $726m | 8% | $1,416m | 9% | 95% | ||
| Freight Rail | n/a | n/a | n/a | n/a | $2,744m | 51% | $5,512m | 58% | 101% | ||
| Ports | 616 | 43% | 526 | 50% | $4,852m | 23% | $15,315m | 37% | 216% | ||
| 1.2 | 10% | 0.6 | 9% | ||||||||
| Airports | 48 | 18% | 13,467,006 | 10% | $1,889m | 9% | $5,081m | 12% | 169% | ||
| Energy |
| 6,224 | 12% | 18,814 |
|
|
|
|
|
| |
| Electricity | 3,581 | 9% | 17,838 | 3% | $2,340m | 15% | $5,165m | 20% | 121% | ||
|
| 3,696 | 10% | 18,270 |
|
|
|
|
|
| ||
| Gas | n/a | n/a | 386.85 | 29% | $528m | 46% | $775m | 24% | 47% | ||
| n/a | n/a | 28.00 | 8% | $94m | 8% | $156m | 10% | 67% | |||
| Petroleum product terminals | n/a | n/a | 14,313 | 18% | $195m | 18% | $383m | 22% | 97% | ||
| Telecommunications |
| 4.36 | n/a | 648 | n/a | $1,356m | 6% | $3,673m | 9% | 171% | |
| 1.38 | n/a | Total households with broadband internet access at home ('000) | |||||||||
| Water & Sewerage | Water | 17,248 | 8% | 453,510 | 6% |
|
|
|
|
| |
| 8,861 | 15% | 854 Properties served - water ('000) | 10% | $1,605m | 15% | $3,143m | 20% | 96% | |||
| Sewerage | 150,000 | 28% | 137,607 | 7% | |||||||
| 13,253 | 10% | 769 | 10% |
|
|
|
|
| |||
Source: ACIL Allen Consulting (2014a)396
________________________________________________________________________________________
396. DEC figures are rounded to the nearest $ million, so percentage changes may not tally exactly with rounded estimates in this table. See Glossary for explanation of abbreviations and terms.