4.6.1.2 Origins/destinations of trips in greater Perth
Figure 82 shows trips in greater Perth by O/D, across road and public transport modes, in terms of DEC for 2011 and projected DEC for 2031. The O/D regions used here are SA3 regions as defined by the ABS.402
This analysis shows that Perth City is the largest O/D for these trips, and is projected to remain so. However, particularly strong population and employment growth is forecast across greater Perth, with high levels of growth projected for many regions, in particular Wanneroo, Swan, Stirling, Belmont-Victoria Park, Canning and Joondalup.
Figure 82: Trips in greater Perth by origin/destination for roads and public transport in 2011 and 2031, measured by DEC ($ million)
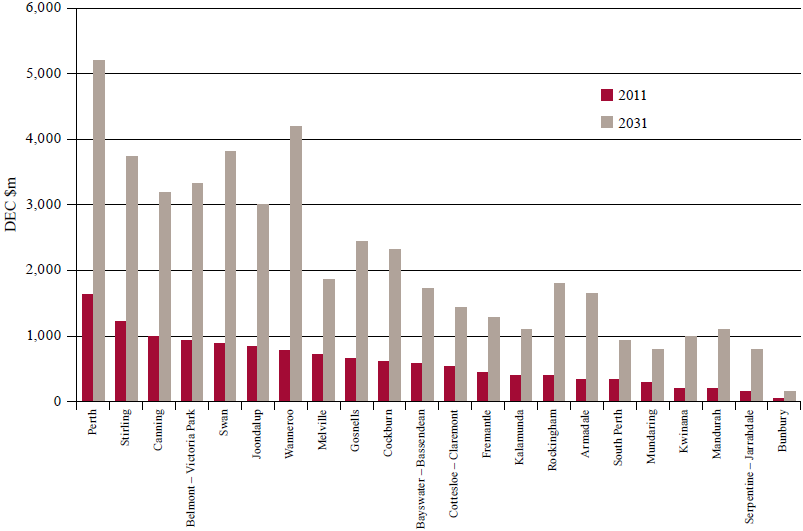
Source: Infrastructure Australia analysis of modelling data from Veitch Lister Consulting (2014e) and ACIL Allen Consulting (2014b)
________________________________________________________________________________________
402. SA3s provide a standardised regional breakup of Australia and generally (although not always) have populations between 30,000 and 130,000 persons.