4.6.1.3 Road corridors in greater Perth
The Audit dataset provides a broad range of data about corridors, and there are many ways of analysing this data. Given the focus of the Audit on economic indicators, the analysis in Table 63 and Table 64 focuses on delay cost. This applies a dollar cost to time delays, based on lost productivity, and taking account of the different costs applicable to different vehicle types.
Some users of the Audit dataset may prefer to use more traditional indicators of congestion, such as traffic volume compared to capacity (V/C). This measure is included in Table 63 and Table 64, as is the DEC measure, which gives insight into the underlying value of activity on the corridor, and the proportion of DEC attributable to delay cost.
These measures are expressed per lane kilometre of road. This normalises the results to facilitate comparison across a wide range of different corridor types - some very long, some consisting of multiple roads, and some relatively short single roads.
The modelling provides one method of measuring and projecting demand for transport infrastructure and the corridors identified in Table 63 and Table 64 reflect this approach. The WA Government may have utilised other data, and different methods of analysis, to inform identification of infrastructure priorities. For further information on the assumptions, included projects and methodology applied in the model, refer to the supporting documentation by Veitch Lister Consulting.
Table 63 shows corridors ranked by delay cost per lane kilometre in 2011, with the equivalent projections for 2031 in Table 64. Taken together, these tables give an indication of which corridors warrant further study, and where interventions are likely to have the biggest economic return.
Table 63: Top 10 road corridors in greater Perth area 2011, by delay cost (2011 dollars)
Rank | Road Corridor | State | Delay cost by | DEC per lane km | Volume Capacity |
1 | Mitchell Fwy Corridor | 1.96 | 5.52 | 70% | |
2 | Leach Hwy Corridor | 1.21 | 3.97 | 61% | |
3 | Canning Hwy/Great Eastern Hwy (west) Corridor | 1.20 | 3.41 | 62% | |
4 | Graham Farmer Fwy/Orrong Rd/Welshpool Rd East Corridor | 1.20 | 3.49 | 62% | |
5 | Roe Hwy Corridor | 0.81 | 2.99 | 65% | |
6 | Reid Hwy Corridor | 0.80 | 2.48 | 62% | |
7 | Tonkin Hwy Corridor | 0.76 | 2.40 | 50% | |
8 | South St/Ranford Rd Corridor | 0.71 | 2.43 | 56% | |
9 | Albany Hwy Corridor | 0.63 | 2.36 | 42% | |
10 | Kwinana Freeway | 0.55 | 1.93 | 40% |
Source: Infrastructure Australia analysis of data from ACIL Allen Consulting (2014b) and Veitch Lister Consulting (2014e)
Table 64: Road corridors in greater Perth metropolitan area 2031, by projected delay cost (>1.75 million per lane km, 2011 dollars)
Rank | Road Corridor | State | Delay cost by | DEC per lane km | Volume Capacity |
1 | Mitchell Fwy Corridor | 10.03 | 16.19 | 86% | |
2 | Tonkin Hwy Corridor | 7.57 | 11.42 | 82% | |
3 | Graham Farmer Fwy/Orrong Rd/Welshpool Rd East Corridor | 7.50 | 11.64 | 82% | |
4 | Marmion Ave/West Coast Hwy Corridor | 6.75 | 9.57 | 85% | |
5 | Wanneroo Rd Corridor | 6.38 | 9.04 | 88% | |
6 | Leach Hwy Corridor | 6.06 | 10.65 | 80% | |
7 | Roe Hwy Corridor | 5.84 | 9.47 | 87% | |
8 | Canning Hwy/Great Eastern Hwy (west) Corridor | 5.52 | 9.49 | 80% | |
9 | Albany Hwy Corridor | 4.63 | 7.90 | 64% | |
10 | Kwinana Freeway | 4.21 | 7.33 | 70% | |
11 | Reid Hwy Corridor | 4.20 | 7.01 | 84% | |
12 | South St/Ranford Rd Corridor | 3.48 | 6.34 | 74% | |
13 | Perth Landsdale Corridor | 2.99 | 6.29 | 69% | |
14 | Nicholson Rd Corridor | 2.95 | 4.79 | 73% | |
15 | Great Eastern Hwy (east)/Guildford Rd Corridor | 2.92 | 5.41 | 52% | |
16 | Gnangara Rd Corridor | 2.20 | 3.94 | 70% | |
17 | North Lake Rd Corridor | 2.08 | 4.54 | 62% | |
18 | Morley Dr/Karrinyup Rd Corridor | 1.98 | 4.72 | 66% | |
19 | Scarborough Beach Rd Corridor | 1.94 | 4.72 | 58% | |
20 | Pinjarra Rd Corridor | 1.81 | 3.67 | 51% | |
21 | Beeliar Dr/Armadale Rd Corridor | 1.76 | 3.45 | 66% |
Source: Infrastructure Australia analysis of data from ACIL Allen Consulting (2014b) and Veitch Lister Consulting (2014e)
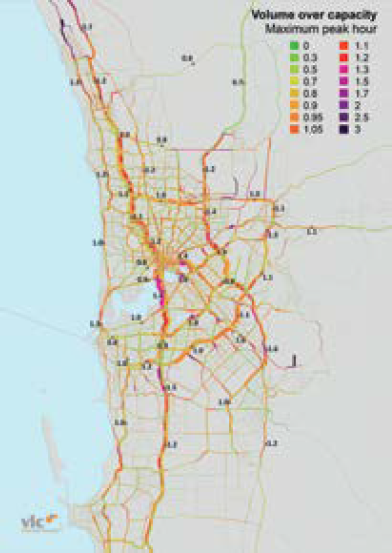
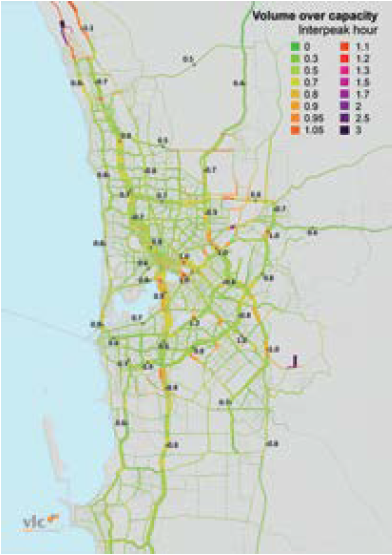
Figure 83 and Figure 84 show projected road congestion in 2031 in the AM peak hour and daytime inter-peak periods respectively. These show the corridors and locations likely to reach or exceed maximum capacity by 2031, in the absence of any additional capacity.
During the AM peak hour several parts of the network show significant congestion in 2031, particularly the Swan River crossings between Perth City and South Perth. In the inter-peak period there is surplus capacity across the network. This suggests some scope for demand management to spread peak period transport flows.
Figure 83: Perth road network volume/capacity
| Figure 84: Perth road network volume/capacity
|
Source: Veitch Lister Consulting (2014e)