4.6.1.5 Rail trips in greater Perth
Table 65 shows the top five SA3 regions for passenger hours travelled across the rail network in greater Perth. Perth City is the dominant O/D region, and is projected to remain so.
Table 65: Top 5 destinations in greater Perth for rail trips by passenger hours travelled (PHT), 2011 and projected 2031
| Perth City | Joondalup | Wanneroo | Cottesloe | Gosnells |
2011 | 22,816 | 4,195 | 2,777 | 2,384 | 2,290 |
2031 | 53,212 | 9,730 | 17,983 | 5,019 | 5,551 |
Source: Veitch Lister Consulting (2014e)
Figure 86 shows that passenger loadings on Perth's rail corridors are projected to increase over time, reaching or exceeding crush capacity on the Joondalup and Mandurah lines by 2031.
Figure 86: Perth rail network weekday passenger demand relative to crush capacity in 2011 and projected in 2031
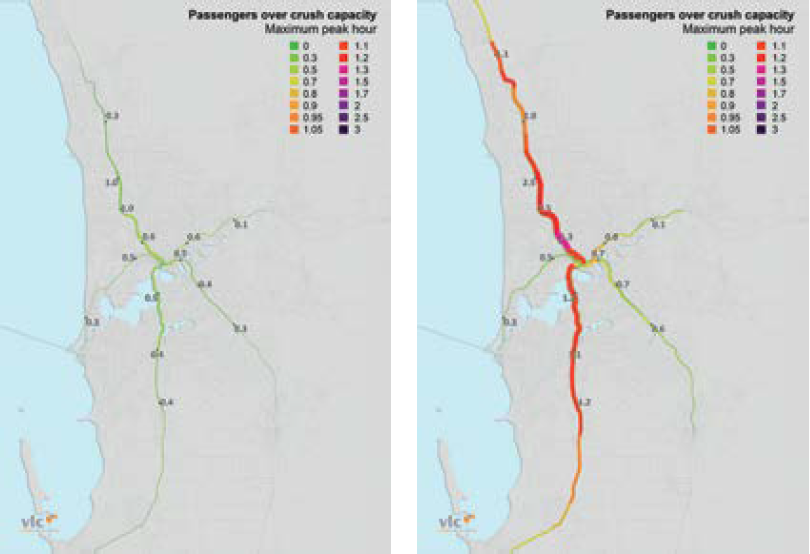
Source: Veitch Lister Consulting (2014e)