5.3 Summary of South Australia infrastructure from 2011 to 2031
In 2011 the DEC of infrastructure in SA was $14 billion, which was seven per cent of the national figure. Figure 89 shows SA DEC for 2011 in the context of the four regions identified for the Audit (the Audit regions).
By 2031, SA infrastructure DEC is projected to increase by around $10 billion, or 71 per cent, to $23 billion. This would represent six per cent of the national DEC. Figure 90 shows projected SA DEC by Audit region in 2031.
Growth in the DEC of SA infrastructure is projected to be fastest in the greater Adelaide region, where it is projected to grow by 74 per cent from $12 billion to $21 billion over the 2011-31 period.
Figure 89: Direct Economic Contribution of infrastructure in South Australia, 2011
|
| ||
|
| <500 | 1 Greater Perth |
|
| 500 - 750 | |
|
| 750 - 1,000 | |
|
| 1,000 - 10,000 | |
|
| 10,000 - 20,000 | |
|
| >20,000 | |
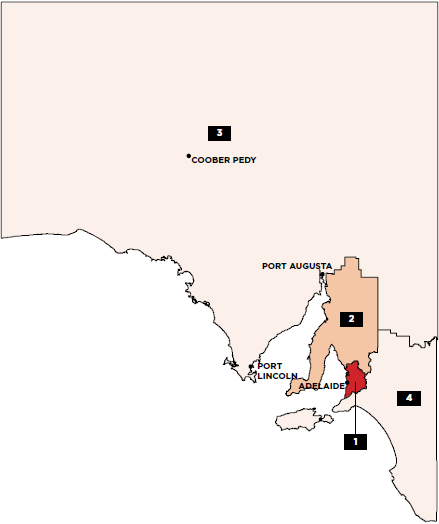


Source: ACIL Allen Consulting (2014a)
Figure 90: Projected Direct Economic Contribution of infrastructure in South Australia, 2031
|
| ||
|
| <500 | 1 Greater Perth |
|
| 500 - 750 | |
|
| 750 - 1,000 | |
|
| 1,000 - 10,000 | |
|
| 10,000 - 20,000 | |
|
| >20,000 | |
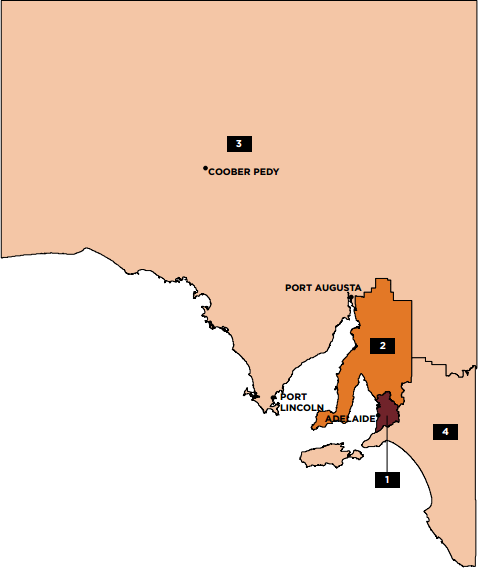
Source: ACIL Allen Consulting (2014a)
Table 71 provides a snapshot of SA economic infrastructure across the four sectors of transport, water, energy and telecommunications. The table notes the capacity of each subsector in general terms and its rate of utilisation in 2011, along with historical (2011) and projected (2031) DEC for each subsector.
Table 71: Overview of South Australian infrastructure
|
| Subsector | Capacity 2011 | Utilisation 2011 | DEC 2011 | DEC 2031 | Projected % increase in DEC | ||||
|
|
|
| % of Nat. |
| % of Nat. |
| % of Nat. |
| % of Nat. | 2011-2031 |
| Transport | Urban | 169,400,000 | 8% | 28,200,000 | 7% | $6,705m | 9% | $12,373m | 7% | 85% |
| Urban | 10,000,000 | 4% | 1,700,000 | 3% | ||||||
| National Highways | 3,860 | 11% | 68,110 | 4% | $511m | 5% | $722m | 5% | 41% | |
| Freight Rail | n/a | n/a | n/a | n/a | $13m | <1% | $15m | <1% | 20% | |
| Ports | 42 | 3% | 38 | 4% | $1,088m | 5% | $1,611m | 4% | 48% | |
| 0.6 | 5% | 0.3 | 4% | |||||||
| Airports | 21 | 8% | 7,807,595 | 6% | $1,687m | 8% | $2,854m | 7% | 69% | |
| Energy |
| 4,438 | 8% | 12,960 |
|
|
|
|
|
|
| Electricity | 3,477 | 8% | 13,045 | 2% | $990m | 6% | $1,571m | 6% | 59% | |
|
| 3,031 | 8% | 11,093 |
|
|
|
|
|
| |
| Gas | n/a | n/a | 116.57 | 9% | $86m | 8% | $105m | 3% | 23% | |
| n/a | n/a | 22.00 | 6% | $151m | 13% | $185m | 12% | 23% | ||
| Petroleum product terminals | n/a | n/a | 2,928 | 4% | $40m | 4% | $52m | 3% | 32% | |
| Telecommunications |
| 4.42 | n/a | 452 | n/a | $1,313m | 6% | $2,307m | 5% | 76% |
| 1.76 | n/a | Total households with broadband internet access at home ('000) | ||||||||
| Water & Sewerage | Water | 10,357 | 8% | 204,215 | 3% |
|
|
|
|
|
| 2,002 | 15% | 736 Properties served - water ('000) | 9% | $947m | 9% | $1,364m | 9% | 44% | ||
| Sewerage | 100,000 | 28% | 93,348 | 5% | ||||||
| 7,700 | 6% | 591 | 8% |
|
|
|
|
| ||
Source: ACIL Allen Consulting (2014a)432
_________________________________________________________________________________________
432. DEC figures are rounded to the nearest $ million, so percentage changes may not tally exactly with rounded estimates in this table. See Glossary for explanation of abbreviations and terms.