5.6.1.2 Origins/destinations of trips in greater Adelaide
Figure 91 shows trips in greater Adelaide by origin/destination (O/D), across road and public transport modes, in terms of DEC for 2011 and projected DEC for 2031. The O/D regions used here are SA3 regions as defined by ABS.440
This analysis shows that Adelaide City is the largest O/D for trips within greater Adelaide. The model also projects significant growth in O/D trips for the Playford region.
Figure 91: Trips in greater Adelaide by origin/destination for road and public transport in 2011 and 2031, measured by DEC ($ million)
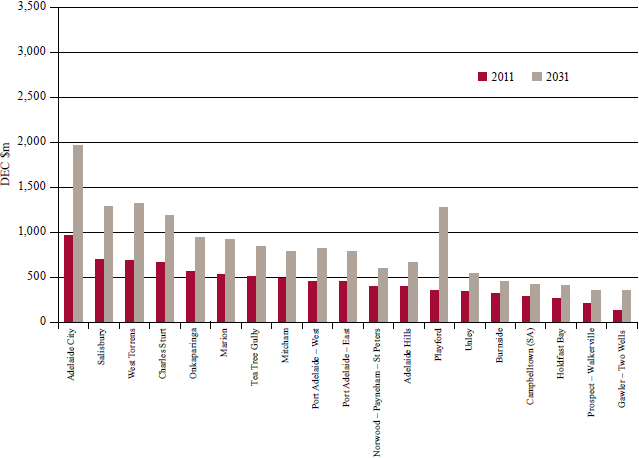
Source: Infrastructure Australia analysis of modelling data ACIL Allen Consulting (2014b)
_________________________________________________________________________________________
440. SA3s provide a standardised regional breakup of Australia and generally (although not always) have populations between 30,000 and 130,000 persons.