5.6.1.5 Rail trips in greater Adelaide
Table 74 shows the top five destination SA3 regions for rail trips in greater Adelaide. This shows that Adelaide City is the dominant destination for rail trips in the greater Adelaide area.
Table 74: Top destinations in greater Adelaide for rail trips by passenger hours travelled (PHT), 2011 and projected 2031
| Adelaide City | Salisbury | Port Adelaide - West | Playford | Onkaparinga |
2011 | 6,145 | 982 | 871 | 844 | 818 |
2031 | 11,852 | 1,450 | 1,280 | 1,954 | 1,987 |
Source: Infrastructure Australia analysis of modelling data from Veitch Lister Consulting (2014f)
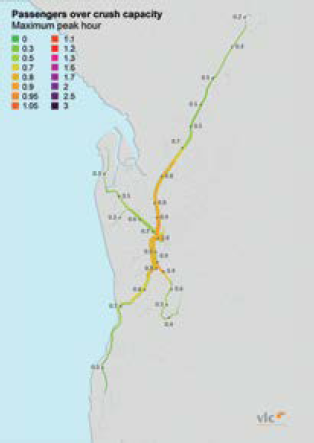
Figure 95 and Figure 96 show that passenger loadings on Adelaide's rail corridors are projected to increase over time, reaching or exceeding crush capacity on the inner sections of the Gawler and Seaford lines by 2031.
Figure 95: Adelaide rail network weekday passenger demand relative to crush capacity (2011)
| Figure 96: Adelaide rail network weekday pas-senger demand relative to crush capacity (2031)
|
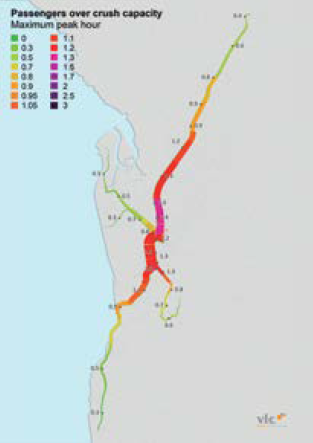
Source: Veitch Lister Consulting (2014f)