6.3 Summary of Tasmanian infrastructure from 2011 to 2031
Table 80 provides a snapshot of Tasmania's economic infrastructure across the four sectors of transport, energy, communications, and water. The table notes the capacity of each subsector in general terms and its rate of utilisation in 2011, along with historical (2011) and projected (2031) DEC for each subsector.
In 2011 the DEC of infrastructure in Tasmania was $3.4 billion, which was about two per cent of the national figure. Figure 99 shows Tasmania's DEC by audit region for 2011.
By 2031, Tasmania's infrastructure DEC is projected to increase by 44 per cent, reaching $4.9 billion, which would be 1.3 per cent of national DEC. Figure 100 shows Tasmania's DEC by audit region in 2031.
Growth will be fastest in Hobart, where DEC is projected to grow by 59 per cent from $1.8 billion to $2.9 billion during the period.
Figure 99: Tasmania Regional DEC 2011
|
|
|
|
|
|
| |
|
|
| |
|
|
| |
|
|
| |
|
| <500 | |
|
| 500 - 750 | |
|
| 750 - 900 | |
|
| 900 - 1,000 | |
|
| 1,000 - 2,000 | |
|
| >2,000 | |
| 1 Hobart 2 Launceston and North East 3 Rest of Tas. | ||
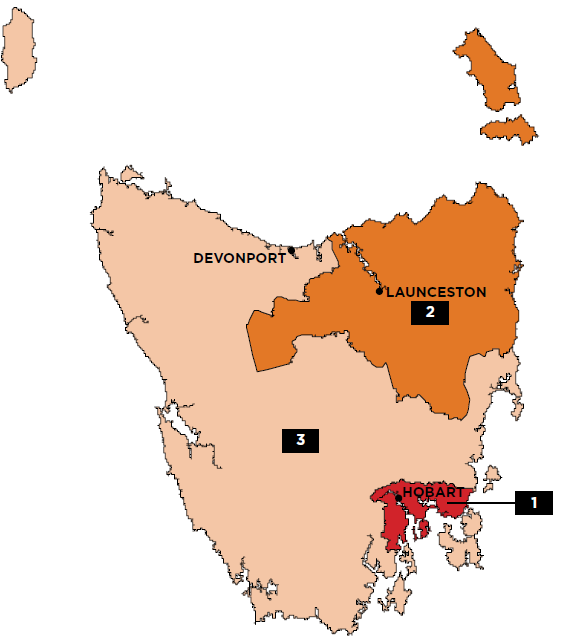


Source: ACIL Allen Consulting (2014a)
Figure 100: Tasmania Regional DEC 2031
|
|
|
|
|
|
| |
|
|
| |
|
|
| |
|
|
| |
|
| <500 | |
|
| 500 - 750 | |
|
| 750 - 900 | |
|
| 900 - 1,000 | |
|
| 1,000 - 2,000 | |
|
| >2,000 | |
| 1 Hobart 2 Launceston and North East 3 Rest of Tas. | ||
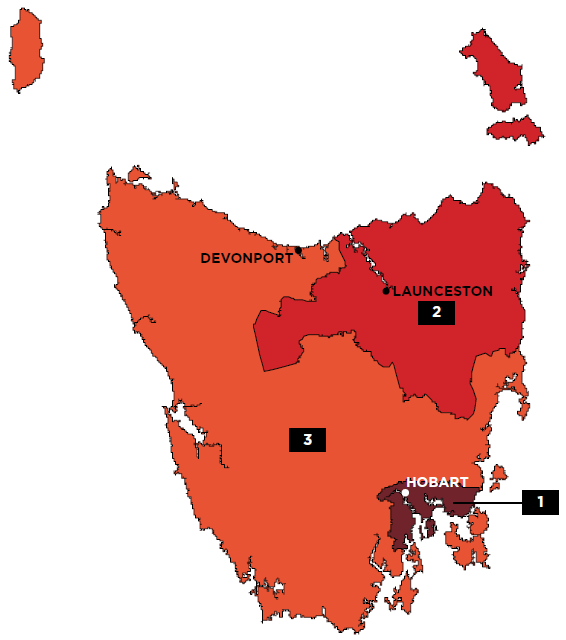
Source: ACIL Allen Consulting (2014a)
Table 80: Overview of Tasmanian infrastructure
|
| Subsector | Capacity 2011 | Utilisation 2011 | DEC 2011 | DEC 2031 | Projected % increase in DEC | ||||
|
|
|
| % of Nat. |
| % of Nat. |
| % of Nat. |
| % of Nat. | 2011-2031 |
| Transport | Urban | Not audited | n/a | Not audited | n/a | $835m | 1% | $1,483m | 2% | 78% |
| Urban | Not audited | n/a | Not audited | n/a | ||||||
| National Highways | 321 | 1% | 135,900 | 7% | $280m | 3% | $406m | 3% | 45% | |
| Freight Rail | n/a | n/a | n/a | n/a | $8m | <1% | $8m | <1% | 9% | |
| Ports | 18 | 1% | 16 | 1% | $337m | 2% | $437m | 1% | 30% | |
| 0.5 | 4% | 0.4 | 6% | |||||||
| Airports | 9 | 3% | 3,316,917 | 3% | $515m | 2% | $771m | 2% | 50% | |
| Energy |
| 2,601 | 5% | 10,863 |
|
|
|
|
|
|
| Electricity | 1,771 | 4% | 10,585 | 2% | $824m | 5% | $939m | 4% | 14% | |
|
| 1,055 | 3% | 4,619 |
|
|
|
|
|
| |
| Gas | n/a | n/a | 16.35 | 1% | $15m | 1% | $23m | 1% | 60% | |
| n/a | n/a | 1.80 | 1% | $13m | 1% | $21m | 1% | 60% | ||
| Petroleum product terminals | n/a | n/a | 1,042 | 1% | $14m | 1% | $17m | 1% | 21% | |
| Telecommunications |
| 4.45 | n/a | 136 | n/a | $347m | 2% | $557m | 1% | 61% |
| 2.14 | n/a | Total households with broadband internet access at home ('000) | ||||||||
| Water & Sewerage | Water | 6,186 | 3% | 76,909 | 1% |
|
|
|
|
|
| 14,283 | 24% | 197 | 2% | $239m | 2% | $282m | 2% | 18% | ||
| Sewerage | 0 | n/a | 60,378 | 3% | ||||||
| 4,535 | 3% | 177 | 2% |
|
|
|
|
| ||
Source: ACIL Allen Consulting (2014a)469
________________________________________________________________________________________
469. DEC figures are rounded to the nearest $ million, so percentage changes may not tally exactly with rounded estimates in this table. See Glossary for explanation of abbreviations and terms.