Origins/destinations of trips in greater Canberra
Figure 102 shows trips in greater Canberra by origin/destination (O/D), as measured by DEC in 2011 and projected DEC for 2031. The O/D regions used here are SA3 regions as defined by the ABS.503
This analysis shows that the North Canberra region is the largest O/D for trips within greater Canberra, followed by Belconnen and Tuggeranong. Gungahlin is projected to grow to become the second largest O/D for trips by 2031.
Figure 102: Trips in Canberra by origin/ destination for roads and public transport in 2011 and 2031, measured by DEC ($ million)
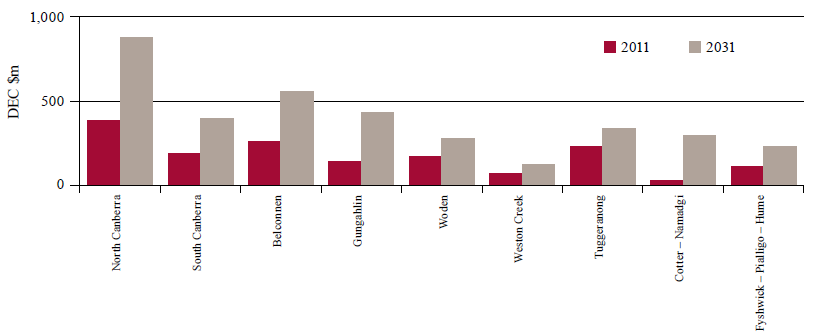
Source: Infrastructure Australia analysis of data from ACIL Allen Consulting (2014b) and Veitch Lister Consulting (2014g)
________________________________________________________________________________________
503. SA3s provide a standardised regional breakup of Australia and generally (although not always) have populations between 30,000 and 130,000 persons.