7.5.1.2 Road corridors in greater Canberra
The Audit dataset provides a broad range of data about corridors, and there are many ways of analysing it. Given the focus of the Audit on economic indicators, the analysis in Table 87 and Table 88 focuses on delay cost. This applies a dollar cost to time delays, based on lost productivity, and takes account of the different costs applicable to different vehicle types.
Some users of the Audit dataset may prefer to use more traditional indicators of congestion such as traffic volume compared to capacity (V/C). This measure is included in Table 87 and Table 88, as is the DEC measure, which gives insight into the underlying value of activity on the corridor, and the proportion of DEC attributable to delay cost.
These measures are expressed per lane kilometre of road. This normalises the results to facilitate comparison across a wide range of corridor types - some very long, some consisting of multiple roads, and some relatively short single roads.
The modelling provides one method of measuring and projecting demand for transport infrastructure and the corridors identified in Table 87 and Table 88 reflect this approach. The ACT Government may have utilised other data, and different methods of analysis, to inform identification of infrastructure priorities. For further information on the assumptions, included projects and methodology applied in the model, refer to the supporting documentation by Veitch Lister Consulting.
Table 87 shows corridors ranked by delay cost per lane kilometre in 2011, with the equivalent projections for 2031 in Table 88. Taken together, these tables give an indication of which corridors warrant further study, and where interventions are likely to have the biggest economic return.
Table 87: Top 10 road corridors in greater Canberra 2011, by delay cost (2011 dollars)
| Rank | Road Corridor | State | Delay cost by | DEC per lane | Volume Capacity |
| 1 | Barton Hwy/Northbourne Ave Corridor | 0.43 | 2.16 | 54% | |
| 2 | Canberra Avenue Corridor | 0.38 | 1.85 | 57% | |
| 3 | Belconnen Way/Barry Dve Corridor | 0.35 | 1.82 | 52% | |
| 4 | Canberra Airport to Civic Corridor | 0.32 | 1.62 | 60% | |
| 5 | Tuggeranong Pky Corridor | 0.28 | 1.58 | 58% | |
| 6 | Macarthur Ave/Limestone Ave/Fairbairn Ave Corridor | 0.20 | 1.37 | 52% | |
| 7 | William Slim Dve/Coulter Dve Corridor | 0.20 | 1.04 | 61% | |
| 8 | Erindale Dve/Yamba Dve Corridor | 0.18 | 1.03 | 52% | |
| 9 | Ginninderra Dve Corridor | 0.18 | 1.16 | 55% | |
| 10 | East-West Corridors | 0.16 | 1.12 | 56% |
Source: Infrastructure Australia analysis of modelling data by Veitch Lister Consulting (2014g)
Table 88: Top 10 road corridors in greater Canberra 2031, by delay cost (2011 dollars)
| Rank | Road Corridor | State | Delay cost by | DEC per lane | Volume Capacity |
| 1 | Canberra Avenue Corridor | 1.22 | 3.69 | 72% | |
| 2 | Barton Hwy/Northbourne Ave Corridor | 1.18 | 3.82 | 68% | |
| 3 | Belconnen Way/Barry Dve Corridor | 1.15 | 3.54 | 67% | |
| 4 | Canberra Airport to Civic Corridor | 1.11 | 3.32 | 79% | |
| 5 | Gungahlin Dve Corridor | 0.76 | 2.98 | 68% | |
| 6 | Macarthur Ave/Limestone Ave/Fairbairn Ave Corridor | 0.68 | 2.55 | 68% | |
| 7 | William Slim Dve/Coulter Dve Corridor | 0.63 | 1.96 | 72% | |
| 8 | Tuggeranong Pky Corridor | 0.60 | 2.53 | 64% | |
| 9 | Monaro Hwy Corridor | 0.59 | 2.98 | 57% | |
| 10 | Gundaroo Dve/Horse Park Dve Corridor | 0.58 | 2.06 | 66% |
Source: Infrastructure Australia analysis of modelling data by Veitch Lister Consulting (2014g)
Figure 103: Canberra road network volume/capacity ratio in 2031 - AM maximum peak hour
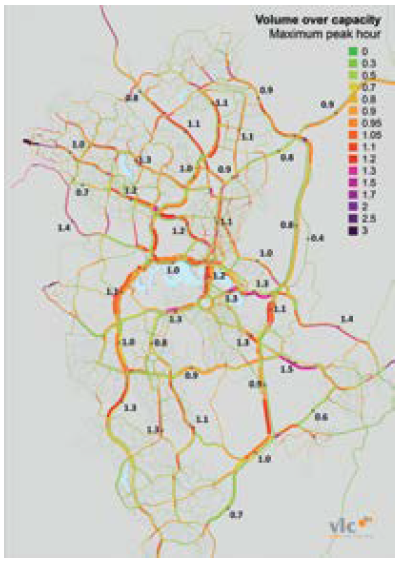
Source: Veitch Lister Consulting (2014g)
Figure 104: Canberra road network volume/capacity ratio in 2031 - daytime inter-peak period
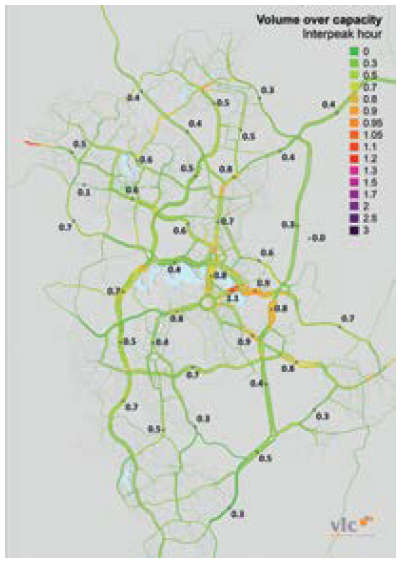
Source: Veitch Lister Consulting (2014g)
The light rail project being developed for the Northbourne Avenue corridor is aligned with the Barton Highway/Northbourne Avenue corridor.
Figure 103 and Figure 104 show projected road congestion in 2031 in the AM peak and daytime inter-peak period, respectively. These show the corridors and locations likely to reach or exceed maximum capacity by 2031, based on current capacity, including projects under construction. While some network constraints exist during the AM peak hour, there remains surplus capacity across the network during the inter-peak period.