8.3 Summary of Northern Territory infrastructure from 2011 to 2031
In 2011, the DEC of infrastructure in the NT was $2.1 billion, which was about one per cent of the national figure. In 2031, the NT infrastructure DEC is projected to increase by around $2.2 billion, or 107 per cent, reaching approximately
$4.3 billion (1.1 per cent of national DEC). This constitutes an average annual growth rate of 3.7 per cent over the 20 years to 2031.
Figure 109 and Figure 110 highlight the spread of infrastructure's economic contribution across the six Audit regions in the NT. DEC growth is projected to be fastest in the Darwin region, increasing by 116 per cent from $1.2 billion to $2.7 billion during the 2011 to 2031 period.
Figure 109: Direct Economic Contribution of infrastructure in the Northern Territory in 2011
|
|
|
|
|
|
| |
|
|
| |
|
|
| |
|
|
| |
|
| <100 | |
|
| 100 - 250 | |
|
| 250 - 500 | |
|
| 500 - 1,000 | |
|
| 1,000 - 2,000 | |
|
| >2,000 | |
|
1 Darwin 2 Alice Springs 3 Barkly 4 Daly - Tiwi - West Arnhem 5 East Arnhem 6 Katherine | ||
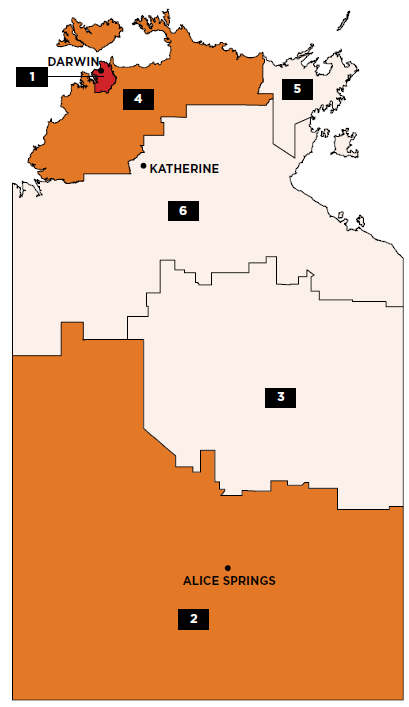


Source: ACIL Allen Consulting (2014a)
Figure 110: Projected Direct Economic Contribution of infrastructure in the Northern Territory in 2031
|
|
|
|
|
|
| |
|
|
| |
|
|
| |
|
|
| |
|
| <100 | |
|
| 100 - 250 | |
|
| 250 - 500 | |
|
| 500 - 1,000 | |
|
| 1,000 - 2,000 | |
|
| >2,000 | |
|
1 Darwin 2 Alice Springs 3 Barkly 4 Daly - Tiwi - West Arnhem 5 East Arnhem 6 Katherine | ||
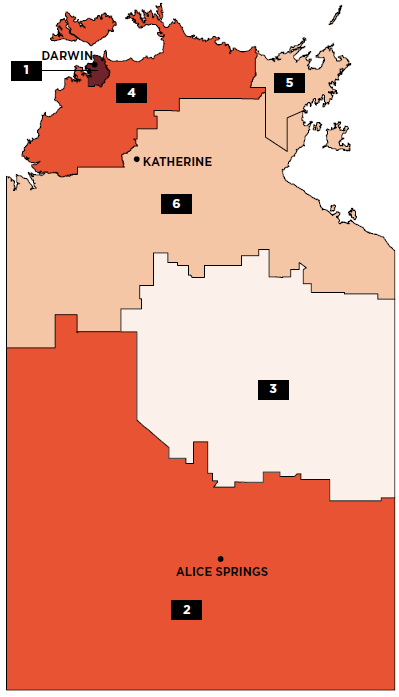
Source: ACIL Allen Consulting (2014a)
Table 92 provides a snapshot of the NT's economic infrastructure across the four sectors of transport, water, energy and communications. The table notes the capacity of each subsector in general terms, and its rate of utilisation in 2011, along with the historical (2011) and projected (2031) DEC for each subsector.
Table 92: Overview of Northern Territory infrastructure
|
| Subsector | Capacity 2011 | Utilisation 2011 | DEC 2011 | DEC 2031 | Projected % increase in DEC | ||||
|
|
|
| % of Nat. |
| % of Nat. |
| % of Nat. |
| % of Nat. | 2011-2031 |
| Transport | Urban | Not audited | n/a | Not audited | n/a | $600m | 1% | $1,431m | 1% | 139% |
| Urban | Not audited | n/a | Not audited | n/a | ||||||
| National Highways | 4,517 | 13% | 8,150 | <1% | $502m | 5% | $1,009m | 6% | 101% | |
| Freight Rail | n/a | n/a | n/a | n/a | $2m | <1% | $3m | <1% | 43% | |
| Ports | 26 | 2% | 16 | 2% | $112m | 1% | $204m | <1% | 83% | |
| 0.2 | 1% | 0.0 | <1% | |||||||
| Airports | 9 | 3% | 1,137,972 | 1% | $519m | 3% | $997m | 2% | 92% | |
| Energy |
| 686 | 1% | 3,293 |
|
|
|
|
|
|
| Electricity | 0 | 0% | 0 | 1% | $119m | 1% | $171m | 1% | 44% | |
|
| 577 | 2% | 3,293 |
|
|
|
|
|
| |
| Gas | n/a | n/a | 43.13 | 3% | $28m | 2% | $70m | 2% | 153% | |
| n/a | n/a | 0.30 | <1% | $4m | <1% | $11m | 1% | 153% | ||
| Petroleum product terminals | n/a | n/a | 1,388 | 2% | $19m | 2% | $32m | 2% | 70% | |
| Telecommunications |
| 3.79 | n/a | 47 | n/a | $105m | <1% | $225m | 1% | 114% |
| 1.20 | n/a | Total households with broadband internet access at home ('000) | ||||||||
| Water & Sewerage | Water | 1,706 | 1% | 38,830 | 1% |
|
|
|
|
|
| 228 | <1% | 62 | 1% | $50m | <1% | $115m | 1% | 132% | ||
| Sewerage | 0 | n/a | 23,499 | 1% | ||||||
| 954 | 1% | 57 | 1% |
|
|
|
|
| ||
Source: ACIL Allen Consulting (2014a)524
________________________________________________________________________________________
524. DEC figures are rounded to the nearest $ million, so percentage changes may not tally exactly with rounded estimates in this table. See Glossary for explanation of abbreviations and terms.