Profitability
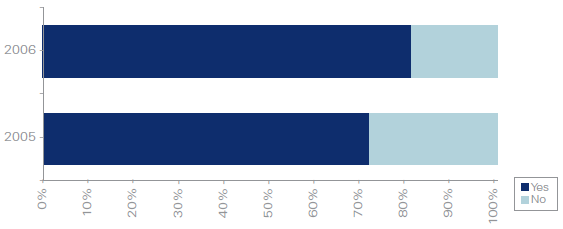
Most contracts are making money, with 83% delivering profits now and 70% having delivered positive profits every year of their operation. In 25% of these cases, those profits have been better than expected - and 3% reported as 'significantly better'. This may reflect the impact of the innovation that some managers were able to create. It is interesting to note that of the 12 contracts that were benchmarked, 9 of them led to price increases of between 0 and 10%.
There is a flip side to these figures that deserves attention though. 17% of contracts are not delivering profits and 38% are delivering less profits than expected, and almost 30% of these (11% overall) are delivering significantly less than expected. The most common reason cited was changes in client requirements while other reasons included third party revenue shortfalls, questions over build quality and TUPE issues leading to extra costs. The high volume and cost of repairs, poor costing and bid management as well as operational SPV servicing costs were other noted causes.
Only 24% said the profitability of their services contract had been impacted by changes in the financial circumstances of the public sector, with the main reasons being an increased focus on deductions and an inability to negotiate price increases. This may reflect the public sector being constrained in its spending and looking to save money on what should have been a fixed price commitment while at the same time seeking service level improvements.
Clearly this will make for a difficult series of discussions and the overall quality of relationships will be key to a satisfactory outcome.
Is the contract currently delivering a positive annual profit?