The reasons for joint buying of common goods and services centrally
1.2 Items that are bought by all or most government departments are called common goods and services. They include items such as office supplies, utilities, information technology and consultants or temporary staff. The government buys billions of pounds of these goods and services (Figure 1 on pages 16 and 17).
1.3 Common goods and services can be bought centrally by government. This means that the government can use its size to negotiate a better combination of price and quality. Government buys goods and services centrally in three main ways:
• Framework agreements are arrangements with a provider, or a list of providers, for a certain good or service. They define what will be purchased (such as maximum price and quality of services) and are valid for a certain number of years. Departments can use the framework to buy common goods and services either directly, or by conducting a short competition among the framework suppliers. As a result, procurement frameworks can be quicker and more efficient for buyer and seller, and can provide better value for money. In 2015-16 departments bought £6.8 billion of goods and services through CCS frameworks.
• Government also directly buys common goods and services centrally. CCS consolidates departmental demand and puts in place contracts for common goods and services. In 2015-16, CCS bought £2.5 billion of common goods and services on behalf of departments.
• Government has put in place technology platforms that allow departments to buy certain goods and services from a wide range of suppliers. The most well-known arrangement is the government's digital marketplace with, among others, the digital and technology framework called G-Cloud.
Figure 1 |
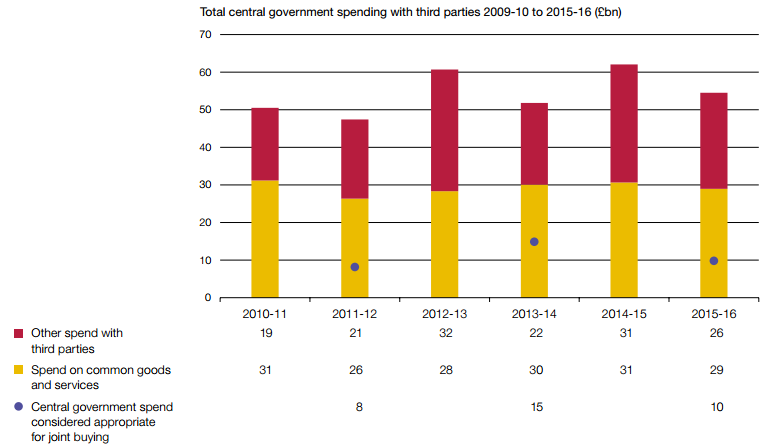
Central government procurement spend (£ billion)
Around half of central government spending with third parties is common across departments but only one-third of this amount is considered appropriate for joint buying
Notes
1 Total government spend with third parties includes common goods and services, department-specific purchases and other items such as grants and government transfers.
2 Common goods and services are divided into 20 categories. The largest categories are information communication and technology (£6.2 billion), facilities (£4.8 billion) and construction (£4 billion). Departments are responsible for classifying expenditure as common goods and services.
3 Estimates and expenditure are expressed in 2015-16 prices.
4 Figures exclude spend by arm's-length bodies and reflect the departmental structure of government as of April 2016.
5 MoD = Ministry of Defence; DfT = Department for Transport; MoJ = Ministry of Justice; DWP = Department for Work & Pensions; DH = Department of Health; HO = Home Office; HMRC = HM Revenue & Customs; BIS = Department for Business, Innovation & Skills; Defra = Department for Environment, Food & Rural Affairs; FCO = Foreign & Commonwealth Office; DfE = Department for Education; DCMS= Department for Culture, Media & Sport; DECC = Department of Energy & Climate Change; DCLG = Department for Communities and Local Government; CO = Cabinet Office; DfID = Department for International Development; HMT = HM Treasury.
Source: Departmental data collected by the Cabinet Office |
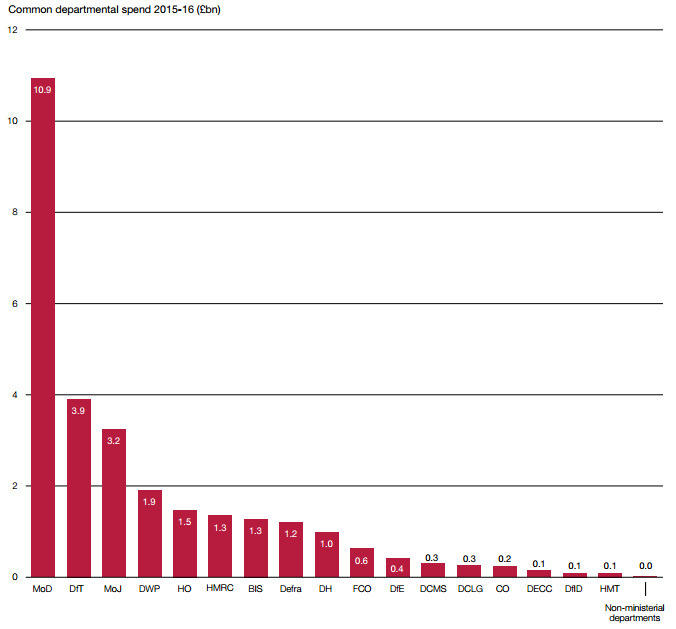
1.4 In 2015-16 central government departments spent around £29 billion in areas that could, in theory, be considered common goods and services (Figure 1). The Ministry of Defence is the largest buyer, followed by the Department for Transport and the Ministry of Justice. CCS estimates that around one-third of this amount is appropriate to be bought centrally. This is because some common goods (such as information technology) can be strategically important, operationally complex or bespoke and departments want to manage these purchases themselves.
1.5 It can be difficult to determine which items are both common across departments and appropriate for a central buying function. Comprehensive, consistent information is not always available and assumptions have to be made about how the goods and services are used. As a result, since 2010 the government has variously estimated that central buying functions should procure as much as £14.8 billion of common goods and services or as little as £8.2 billion. It currently estimates the value at £9.8 billion.
1.6 As well as the difficulty of estimating the goods and services that are appropriate to be bought centrally, buying common goods and services can be complex. Departments often have different views about which goods and services are common and which should be bought centrally. They may have subtly different needs and genuine reasons for needing bespoke products or services. Even when joint buying is agreed, departments will need to carry out important activities. These complexities mean that departments must collaborate and communicate clearly to allow a central buying team to buy goods or services effectively and efficiently.
1.7 We have previously reported on the difficulty that departments can experience working together. Our reports on central buying activities and shared services describe issues such as unrealistic targets and unclear plans, poor-quality data and systems, inadequate assurance and control, and weak governance (Figure 2).
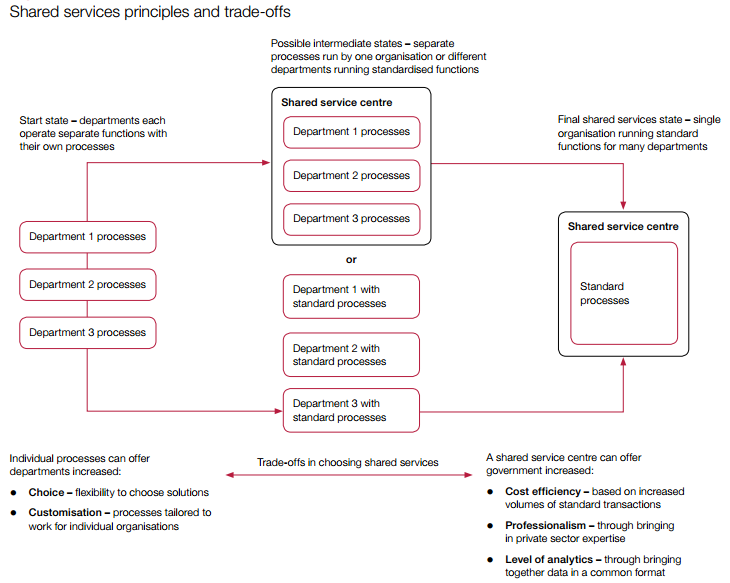
1.8 We have also previously reported on the trade-offs inherent in centralised and shared service arrangements. We have found that while centralised and shared services can offer benefits, individual organisations will generally have to accept services that are less tailored. Figure 3 on page 20 shows the principles of moving to shared services and the trade-offs involved. When the specific shared service is joint buying the trade-offs can be more difficult to manage because the central buying organisation has an important role in specifying requirements and selecting suppliers.
Figure 2 |
Previously reported challenges with central buying and shared services
NAO report | Unclear baselines or overambitious targets | Lack of a clear plan | Inadequate data | Weak governance, assurance or control | Lack of customer buy-in |
Reducing the cost of procuring Fire and Rescue Service vehicles and specialist equipment (2010) |
|
|
|
|
|
A review of collaborative procurement across the public sector (2010) |
|
|
|
|
|
The Government Procurement Card (2012) |
|
|
|
|
|
Efficiency and reform in government corporate functions through shared service centres (2012) |
|
|
|
|
|
The impact of government's ICT savings initiatives (2013) |
|
|
|
|
|
|
|
|
|
| |
Police procurement (2010) |
|
|
|
|
|
Shared service centres (2016) |
|
|
|
|
|
Investigation into members' experience of civil service pension administration (2016) |
|
|
|
|
|
 Findings in previous report
Sources: Reports by the Comptroller and Auditor General 2010 to 2016 |
Figure 3 |
Source: National Audit Office |