The reported cost of the Portfolio is higher than in 2012
2.7 In September 2012 the Portfolio consisted of 191 projects. The 2013 annual report states that the budgeted whole-life costs of these projects was £354 billion but the total costs disclosed in the supporting data published by departments was only £306 billion because departments withheld whole-life cost data for 36 projects. In June 2015 the Portfolio consisted of 149 projects with a budgeted whole-life cost of £511 billion.
Nine of these projects are deemed to have information that is not disclosable, leaving a budgeted portfolio of £436 billion for which supporting information is available and can be compared with the £306 billion above. This supports our conclusion in paragraph 2.5 above that more information has become available. The majority of the increase in reported costs occurred between September 2012 and September 2013.
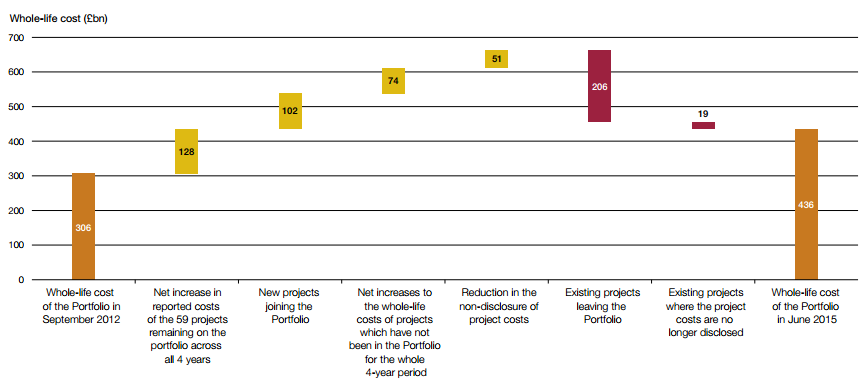
2.8 It is difficult to make comparisons at a portfolio level between years because of changes in the composition of the Portfolio, changes in the amount of exempted data, and the use of different cost bases. We have tried to establish the reasons for changes in whole-life costs for those projects for which we have data. Figure 5 shows that the changes are due to:
a 107 new projects joining the portfolio (£102 billion);
b reduction in the non-disclosure of project costs (£51 billion);
c a net increase of 81% in reported costs of the 59 projects remaining on the portfolio across all 4 years from £159 billion in 2012 to £288 billion in 2015.8 Of these, 40 projects' costs increased by a total of £147 billion and 19 projects' costs decreased by a total of £19 billion; and
d net increases in the whole-life costs of projects which have not been in the Portfolio for the whole 4-year period that we analysed (£74 billion).
The increases listed above more than offset the effect of the 149 projects with whole-life costs of £206 billion leaving the Portfolio.
2.9 Projects are removed when they become operational or are otherwise deemed no longer to require the Authority's oversight. Of the 149 projects removed from the Portfolio, 39% were moved to 'business as usual'; 26% were completed; 12% merged with another project or disaggregated into separate projects; 7% were cancelled; and 16% were removed for a variety of other reasons.
2.10 In June 2015, 65 projects with a whole-life cost of £147 billion left the Portfolio. The cost change is largely accounted for by 4 projects:
• Department of Energy & Climate Change's Renewable Heat Incentive (£44 billion) left the Portfolio as the project has been completed.
• Department of Energy & Climate Change's Final Investment Decision Enabling for Renewables (£22 billion) left the Portfolio after the contracts were let.
• The Ministry of Defence's Typhoon project (£18.8 billion) moved to business as usual as the final tranche of aircraft entered service.
• The Ministry of Defence's Mounted Close Combat project (£17 billion) was disaggregated into 4 programmes, of which two immediately entered the Portfolio.
Figure 5 Breakdown of how costs have changed between 2012 and 2015 The Portfolio's net change in whole-life cost between 2012 and 2015 was £130 billion. There was an overall increase of £355 billion and reduction of £226 billion
| |
| Decrease |
| Increase |
| Aggregate cost |
Notes 1 There are undisclosed project costs that have not been included in the above analysis. In September 2012, this amounted to £48 billion and in June 2015, £75 billion. 2 Seventy-three projects remain in the Portfolio across all 4 years. The 59 projects exclude projects where costs are undisclosed. 3 A total of 149 projects have left the portfolio since 2012. In 2013, 36 projects were removed; in 2014, 48 projects were removed; and in 2015, 65 projects were removed. Source: National Audit Office analysis of departmental data published alongside the Major Projects Authority annual reports 2012-13, 2013-14, 2014-15, and June 2015 departmental data provided to the Authority | |


2.11 In paragraph 2.8, we state that the 59 projects which remained in the Portfolio had a net increase of £147 billion. Eight projects made up 95% of this increase. An analysis of these projects shows that the main reasons were more of the costs being disclosed, the inclusion of costs previously unknown or uncertain, and changes in methodology or scope. It is not due to increases in the costs previously reported (Figure 6). These factors are likely to persist as the Portfolio develops. But this is not an argument for excluding projects from the Portfolio early in their life while cost estimates are finalised as inclusion ensures appropriate scrutiny.
Figure 6 The 8 projects with the largest increase in whole-life cost remaining on the Portfolio across all 4 years (2012-2015) Of the 59 projects listed in all 4 years, 8 projects make up 95% of the £147 billion increase in costs | ||
Project | Whole-life cost increase | Reason for the increase |
Department of Energy & Climate Change's Electricity Market Reform Programme | £40 million in 2012 to £48,241 million in 2015 | The department revised its methodology to calculate the whole-life costs of major projects so that it includes costs to be funded through low-carbon electricity levies, not taxation. |
Department of Energy & Climate Change's Final Investment Decision Enabling for Hinkley Point C | £21 million in 2012 to £14,286 million in 2015 | As above. |
Department for Transport's High Speed Rail Programme (HS2) | £1 billion in 2012 to £43 billion in 2015 | The 2012 costs related only to preparation of the hybrid bill, when the budget beyond that time was unknown. The 2015 cost is the total funding allocated for the project, which the government announced in the 2013 Spending Review. |
Ministry of Defence's Complex Weapons | £4 billion in 2012 to £18.5 billion in 2015 | More projects entered the complex weapons pipeline over this period. |
Ministry of Defence's Nuclear warhead capability sustainment programme | £12 billion in 2012 to £21.8 billion in 2015 | Information is exempt from disclosure under the Freedom of Information Act. |
Intercity Express Programme (IEP) | £1.3 billion in 2012 to £6.2 billion in 2015 | The 2012 costs included rolling stock costs only. The 2015 cost now includes the associated Network Rail infrastructure costs, which were not previously reported. |
Department of Health's Public Health England Science Hub | £6.2 billion in 2012 to £10 billion in 2015 | Change in cost reflects agreed and significantly enhanced scope of the project. The increase also in part relates to an agreed allowance for inflation from 2012 to 2015. The majority of the total cost represents running costs of a significant proportion of Public Health England for the next 60 years. |
Department of Energy & Climate Change's smart meters implementation programme | £17 billion in 2012 to £19 billion in 2015 | Increase is due to a change in methodology in calculating costs and not by any underlying cost changes. |
Note 1 Seventy-three projects remain in the Portfolio across all 4 years. The 59 projects exclude projects where costs are undisclosed. Source: National Audit Office analysis of departmental data published alongside the Major Projects Authority annual reports 2012-13, 2013-14, 2014-15, and June 2015 departmental data provided to the Authority | ||
________________________________________________________________________
8 This excludes projects where costs have not been disclosed.