There are more concerns about the deliverability of some projects
2.12 When it carries out assurance reviews, the Authority awards projects a delivery confidence rating using a 'traffic light' approach (Figure 7).
2.13 The most recent data available to us shows that there are 50 projects in the Portfolio where successful delivery was in doubt or unachievable (rated red or amber-red). There is no clear comparison with the data disclosed in the 2012 annual report for projects in the Portfolio at September 2012, of which 30 were rated red or amber-red (Figure 8 overleaf). The difference is partly explained by the Authority adding 21 red or amber-red projects to the Portfolio between 2012 and 2015. Eighteen other projects' ratings declined to red or amber-red between 2012 and 2015 and 6 projects showed no improvement from red or amber-red.
2.14 The number of projects where successful delivery was highly likely or probable (rated green or amber-green) has fallen from 82 in 2012 to 44 in 2015. This is largely due to the removal of 66 projects that had green or amber-green ratings from the Portfolio and 26 existing and new projects improving their ratings to green and amber-green.
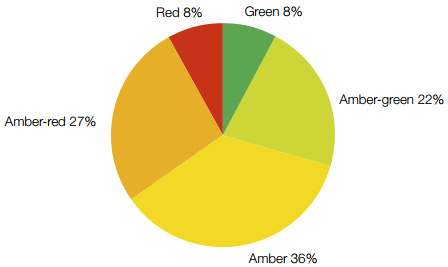
2.15 A particular concern is that the Authority has rated the delivery of one-third of projects scheduled to finish in the next 5 years as being in doubt or unachievable (Figure 9 on page 27).
Figure 7 The Authority's delivery confidence ratings | |
Rating | Description |
| Successful delivery of the project on time, budget and quality appears highly likely and there are no major outstanding issues that at this stage appear to threaten delivery significantly. |
| Successful delivery appears probable; however, constant attention will be needed to ensure risks do not materialise into major issues threatening delivery. |
| Successful delivery appears feasible but significant issues already exist, requiring management attention. These appear resolvable at this stage and, if addressed promptly, should not present a cost or schedule overrun. |
| Successful delivery of the project is in doubt, with major risks or issues apparent in a number of key areas. Urgent action is needed to ensure these are addressed, and whether resolution is feasible. |
| Successful delivery of the project appears to be unachievable. There are major issues with project definition, schedule, budget, quality or benefits delivery, or both, which at this stage do not appear to be manageable or resolvable. The project may need re-scoping or its overall viability reassessed, or both. |
Source: Major Projects Authority Annual Report 2014-15 | |


Figure 8 Delivery confidence ratings of government major projects over a 4-year period The increase in the Portfolio's projects where successful delivery was in doubt or unachievable between 2012 and 2015 is partly explained by the Authority adding red or amber-red projects to the Portfolio, project ratings declining and projects showing no improvement from red or amber-red
| |
| Exempt or not provided |
| Red |
| Amber-red |
| Amber |
| Amber-green |
| Green |
Note 1 Due to rounding, columns do not always total 100%. Source: National Audit Office analysis of departmental data published alongside the Major Projects Authority annual reports 2012-13, 2013-14, 2014-15, and June 2015 departmental data provided to the Authority | |
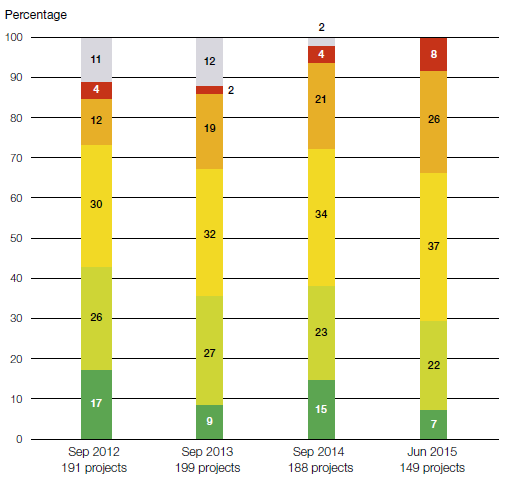


Figure 9 Delivery confidence rating of 106 projects scheduled to finish between 2015-16 and 2019-20 The Authority has rated more than one third of the 106 projects scheduled to finish by the end of the financial year 2019-20 as red or amber-red - successful delivery is in doubt or unachievable
Source: National Audit Office analysis of departmental data provided to the Major Projects Authority |
2.16 The delivery confidence ratings reflect uncertainty and risk as well as the performance of projects. Uncertainty reduces through the project lifecycle, but our analysis shows that not all project ratings improve over time. When examining the 56 projects remaining on the portfolio across all 4 years between 2012 and 2015,9 we found the number of projects considered highly likely to deliver on time and on budget (rated green or amber-green) increased from 16 in 2012 to 25 in 2015 (Figure 10 overleaf). However, projects where successful delivery was in doubt or unachievable (rated red and amber-red) have also increased from 12 in 2012 to 17 in 2015.
____________________________________________________________________________________
9 Projects where delivery ratings have not been disclosed have not been included in this analysis.