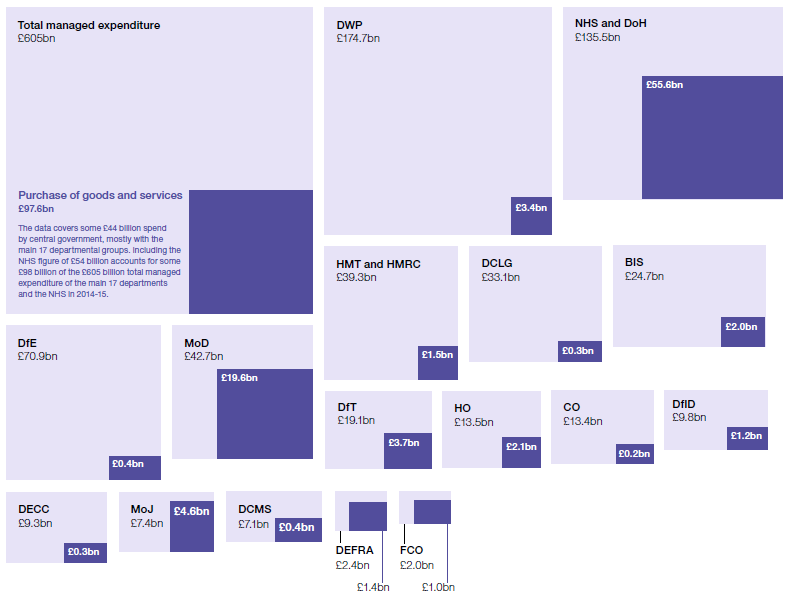
Contracts are spread across government
|
Notes 1 Total managed expenditure is from Table 1.13 of the Treasury’s Public Expenditure Statistical Analyses (PESA), published August 2015. 2 Totals for spend on goods and services, and the break-down by category, is from departmental data on 2014-15 procurement spend from the Cabinet Office’s spend analysis tool. This data is not entirely consistent with the PESA data due to the way data is reported. It does not cover all bodies, and the break-down by category (bar chart) includes some spend by entities not included in the expenditure by department diagram. |