Year-on-year site level performance
2.8 Since the May 2011 performance plan, work on the site has cost more and taken longer than planned (Figure 3 on page 10). The Authority and Sellafield Limited routinely monitor performance on cost and schedule against the performance plan for the site. It monitors performance at an aggregate level, based on detailed data for the projects within the 23 programmes on site. Cost and schedule performance against the plan deteriorated slightly between 2012-13 and 2013-14. During 2014-15 performance has improved, with in-year costs being slightly less than planned, and progress against schedule being closer to, though still behind, plan.
Figure 2 Breakdown of increases in the size of the provision for Sellafield The majority of the increases in the provision for Sellafield has been for increases in the costs of the work
Source: Nuclear Decommissioning Authority Annual Reports and Accounts 2011-12 to 2013-14 |
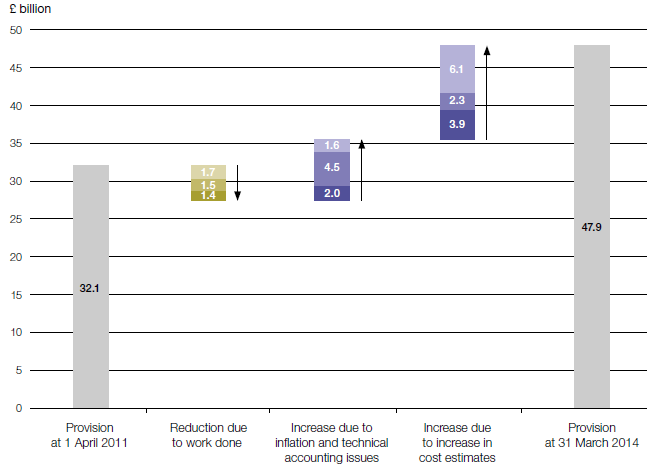
 Increases 2011-12
  Increases 2012-13
  Increases 2013-14
  Decreases 2011-12
  Decreases 2012-13
  Decreases 2013-14
Figure 3 Cost and schedule performance indices across the site Work on the site has cost more and taken longer than planned
Notes 1 The indices show the relationship between the budgeted cost of work performed and the actual cost of work performed (cost performance index or CPI) and the budgeted cost of work performed and the budgeted cost of work scheduled (schedule performance index or SPI). 2 An SPI of 1 would show that the Authority had delivered all the work scheduled in that period. A CPI of 1 would show that the work performed had cost what it was budgeted to cost. A score of less than 1 indicates poorer performance than planned, and a score of more than 1 indicates better performance than planned. 3 Figures for 2012-13 and 2013-14 show the cumulative position from implementation of the 2011 performance plan. Source: National Audit Office analysis of Authority information |