Progress in decommissioning the legacy ponds and silos
2.10 Estimated completion dates for the four legacy ponds and silos programmes were extended significantly between 2007 and 2010 and brought forward again when the Authority agreed the 2011 performance plan. In its latest lifetime plan, Sellafield Limited has made little change to its estimated forecast completion dates for the two pond programmes which are in the construction phase. Sellafield Limited has put back its expected completion dates for the two silos programmes, by 10 and 14 years respectively. These programmes are in the planning and design phase and Sellafield Limited has re-evaluated its estimates of the time it will take to retrieve waste (Figure 5 on page 12).
Figure 4 Sellafield Limited's operations Sellafield Limited has fallen short of most of its operational targets in recent years
Note 1 Units are tonnes equivalent of nuclear fuel being processed. Source: National Audit Office analysis of Authority information |
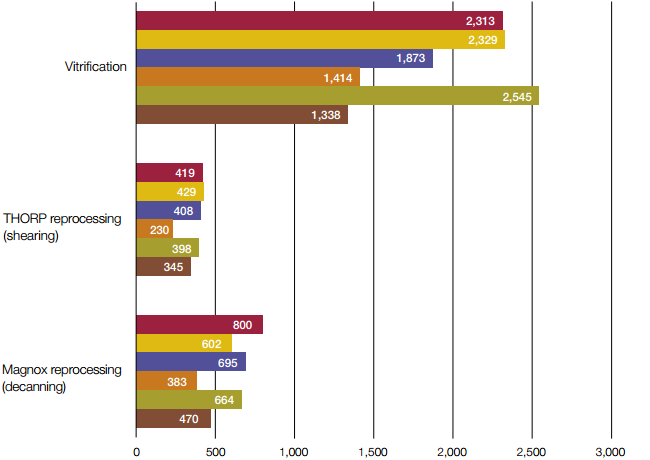
 2011-12 target
 2011-12 actual
 2012-13 target
 2012-13 actual
 2013-14 target
 2013-14 actual
2.11 The revisions to the completion dates for the legacy ponds and silos in the 2014 performance plan reflect slower progress than expected over recent years and Sellafield Limited's improved understanding of the challenges that may be involved. Sellafield Limited has not met the planned schedules in the May 2011 performance plan for any of the four legacy ponds and silos programmes. It has fallen behind schedule the most on the pile fuel cladding silo programme and made best progress on the pile fuel storage pond, where progress is just behind schedule. It has delivered the work at lower than the budgeted cost for two of the programmes but exceeded it for the other two (Figure 6 overleaf).
Figure 5 Forecast completion dates for the legacy ponds and silos programmes Expected completion date for two programmes have been put back by 10 and 14 years
Source: Nuclear Decommissioning Authority |
| Figure 6 Cost and schedule performance indices for the legacy ponds and silos programmes None of the programmes has delivered all of their scheduled work and two have exceeded their budgeted costs
Notes 1 The indices show the relationship between the budgeted cost of work performed and the actual cost of work performed (cost performance index or CPI) and the budgeted cost of work performed and the budgeted cost of work scheduled (schedule performance index or SPI). 2 An SPI of 1 would show that the Authority had delivered all the work scheduled in that period. A CPI of 1 would show that the work performed had cost what it was budgeted to cost. A score of less than 1 indicates poorer performance than planned, and a score of more than 1 indicates better performance than planned. 3 Figures for 2012-13 and 2013-14 show the cumulative position from implementation of the 2011 performance plan. Source: Nuclear Decommissioning Authority | |||||||||||||||||||||||||||||||||||||||||||||||||||||||