Process
2.12 The Department's preferred option from 2007 was a full tunnel, involving a storage tunnel intercepting CSOs from West to East London and transferring waste water to Beckton sewage works. It was developed alongside a range of other potential solutions to overflows, in three separate exercises over the period 2000-2010:
• The Thames Tideway Strategic Study (2000-2005):9 considered options based on location (before waste water reached sewers, in the sewers, at the CSOs, and in the river), and then conducted feasibility, modelling and cost-benefit studies on eight sub-options to address spills at CSOs.
• The Thames Tideway Advisory Group (2005-06): considered three variants of a full tunnel option, against three variants for a two-tunnel solution involving tunnels west and east of London. The option appraisal considered dissolved oxygen compliance, spill frequency and benefits and costs.
• The Needs Report (2009-10): considered three routes for a full tunnel option and two alternative approaches: Sustainable Urban Drainage Systems, and In-Sewer Separation. The option appraisal considered dissolved oxygen compliance for different tunnel configurations, but only spill frequency and cost for the alternatives.
Figure 5 Estimated spills at monitored Combined Sewer Overflows in 2016 Combined Sewer Overflows along the Tideway continue to discharge all year round |
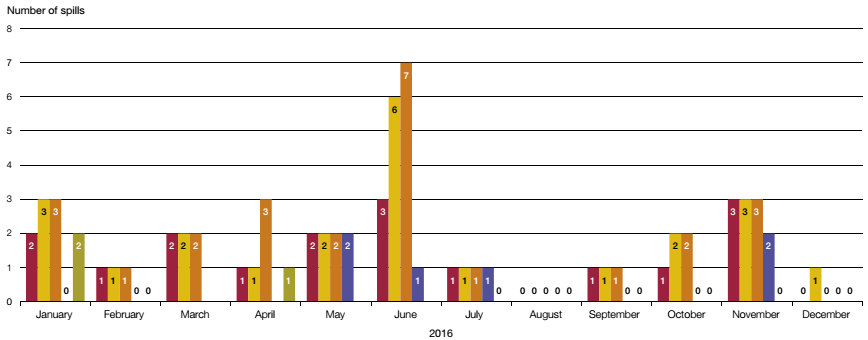
| Hammersmith |
| Lots Road |
| Western |
| Greenwich |
| Abbey Mills |
Notes 1 Spill counting follows the Thames Water methodology of counting all discharges not separated by a 24 hour dry period as a single spill. 2 Figures are estimates due to the role of human input in recording discharge duration and volumes. Source: National Audit Office analysis of Thames Water data | |


Figure 6 Comparison of the project's target spill criterion against other guidance | |
Water body | Maximum allowed number of spills per CSO |
UK Shellfish waters | 10 per year |
UK Bathing waters | 3 per bathing season |
Thames Tideway | 4 per 'typical year'1 |
Belgium (vulnerable water bodies) | 7 per year |
Belgium (non-vulnerable water bodies) | 10 per year |
Netherlands (coastal and transitional waters) | 10 per year on average |
Poland (leisure/public areas) | 10 per year |
Ireland (recreational waters) | 6 per year |
Note 1 Assessed over a 41 year rainfall series (1970 to 2010), the Tunnel solution was forecast by Thames Water to result in between 1 and 7 spill events in a year, depending on the year. Source: Milieu, Assessment of Impact of storm water overfl ows from combined waste water collecting systems on water bodies in the 28 EU Member States, January 2016; DETR, Working Document for Dischargers and Regulators, July 1997, updated April 2009 | |
___________________________________________________________
9 The Steering Group consisted of Thames Water who funded the Study, the Department, the Environment Agency, the Greater London Authority; and the Water Services Regulation Authority (Ofwat) which maintained observer status.