Assessment
2.13 In our 2014 report (Figure 1) we said we would expect the Department and the Environment Agency (and where appropriate Ofwat) to have:
• ensured clear links between objectives and appraisal criteria;
• ensured a comprehensive appraisal of a broad range of options;
• established a robust evidence base to understand the effectiveness, costs and benefits of proposed solutions, reflecting the most up-to-date information, and including sensitivity analysis to test the feasibility and forecast environmental impact of options; and
• subjected all appraisal work to quality assurance to check for errors and scrutinise the underlying assumptions in models.
2.14 For approval, solutions needed to achieve the dissolved oxygen standards based on estimated population growth and climate change to 2021. To simplify compliance testing of alternatives to the Full Tunnel solution, Thames Water and the Environment Agency agreed that a four spills annual threshold in a modelled 'typical year' would meet the environment standards and comply with the Directive.
2.15 We found a wide range of solutions were considered, although combinations of alternative technologies were not appraised after the Department endorsed a full-length tunnel as the preferred option in 2007. In part, this decision was based on a desire to limit the risk of European fines. The Department reviewed its position and concluded in 2014 that, given the 2012 Court of Justice ruling, pausing the Tunnel to consider alternatives further would likely increase the risk of fines for breaching the Directive.
2.16 The Department assessed the Full Tunnel option as the lowest-cost option that would achieve its objectives by 2020. The Department considered that alternatives either did not achieve the dissolved oxygen standards, led to too-frequent spills, or would only achieve equivalent performance to the Tunnel at far greater cost (Figure 7).
| Figure 7 Thames Tideway: Solutions appraised 2000-2010 Option appraisals reporting in 2005, 2006, and 2010 indicated that alternatives to the Full Tunnel either failed the dissolved oxygen standards or cost more than the Tunnel |
|
| Compliance with dissolved oxygen standard | Spills events in the 'typical year' for highest spilling CSO | Delivery timescale relative to 2015 | Cost, 2016 prices (£bn) |
| Baseline: Lee Tunnel and treatment plant upgrades (2010) | Fail | 59 | not assessed | not costed |
| Sustainable Urban Drainage Systems (2010) | Fail2 | >10 | 25+ years | 11.2-24.0 |
| In-Sewer Separation (2010) | Pass2 | 4 | 25+ years | 12.1-25.8 |
| Two Tunnel/East-West Solution (2006) | Fail | 93 | 5 years | 2.4-2.5 |
| Full Tunnel Option (2010) | Pass | 4 | 6 years | 4.2 |
| Transfer to high capacity treatment plant (2005) | Fail | not assessed | not assessed | 1.2-2.6 |
| Multiple screened outlets (2005) | Fail | not assessed | not assessed | 1.4-4.1 |
| Multiple screened outlets and storage (2005) | Fail | not assessed | not assessed | 1.9-5.0 |
| Storage shafts by riverside (2005) | Fail | not assessed | not assessed | 1.5-3.5 |
| Screening at individual CSOs (2005) | Fail | not assessed | not assessed | 11.7 |
| Displacement to wetlands (2005) | Fail | not assessed | not assessed | 2.7 |
| In river: Bubblers and skimmers (2005) | Not assessed | as baseline | not assessed | not costed |
| Notes 1 Where options were assessed multiple times, figures refer to the most recent exercise. 2 Conformity with the dissolved oxygen standard was not explicitly modelled for these options, but assessed using the four spills criterion. 3 On average 9 spills per year was predicted for CSOs intercepted by the Tunnel, but non-intercepted CSOs were assessed to spill as per the baseline. Source: Thames Tideway Strategic Study, Solutions Working Group Report 2005, Thames Water, Tackling London’s Sewer Overflows, 2006, Thames Water, Needs Report, 2010 | ||||
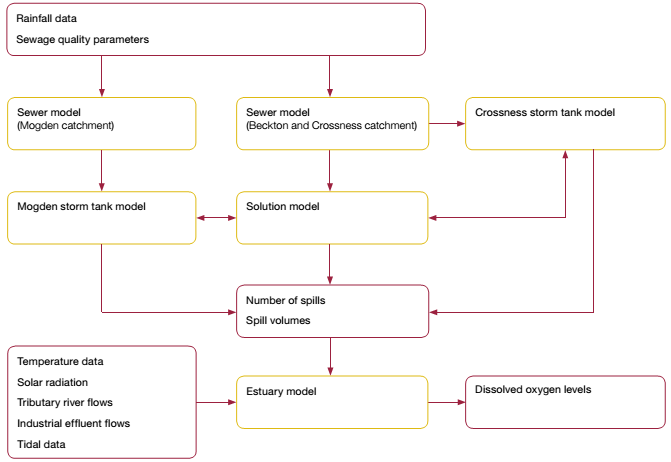
2.17 Modelling was a key element of the decision-making process (Figure 8). For alternative solutions this estimated:
• CSO average spill volumes. The Sewer Model estimated average spill volumes by CSO for 21 rainfall events, which were then used to assess whether they were unsatisfactory, according to the Environment Agency's thresholds for defining harm.
• Spills in a typical year. The Sewer Model used rainfall data from a 'typical year' (1979-80) to estimate the number of spills which would result with a solution in place.
• Whether the dissolved oxygen standards would be met. The water quality (Estuary) model used a historical rainfall data series to predict the number of breaches of the four dissolved oxygen thresholds which would have resulted over 34 years with a solution in place, permitting this to be compared with allowed number of breaches over this period.
2.18 Reviewers have found that Thames Water's sewer model broadly follows good practice. It has been refined since 2007, enabling the Tunnel's final design to be 9 kilometres shorter, reducing estimated costs by £646 million. Despite improvements in the model's predictive ability, Thames Water told us it did not revisit previously appraised solutions as the Secretary of State had already written to Thames Water in 2007 asking it to proceed with a full-length tunnel.
2.19 Ofwat has, through its consultant Mott Macdonald, scrutinised Thames Water's Tunnel costings since 2007. Challenges have led to revisions in costings as the project has progressed. Mott MacDonald is involved elsewhere in the project, performing design work for the consortia of contractors undertaking the Tunnel's East section. Ofwat has put in place a mechanism to prevent conflicts of interest, which we have not audited as part of this review. There was no independent scrutiny of costings for alternative options to the Tunnel.
2.20 The Environment Agency used outputs from the modelling to test the compliance of options with its success criteria (paragraph 2.4). We found that the Environment Agency relied principally on Thames Water and Thames's consultants to gain assurance over the models, and that it could not provide evidence that it had sufficiently understood the impact of uncertainty over modelling inputs to two key areas of the option appraisal:
• Categorisation of unsatisfactory CSOs. In identifying unsatisfactory CSOs, the Environment Agency relied on Thames Water data from 21 rainfall events, but could not explain to us how these events had been chosen or why they were representative of usual weather conditions.
• Compliance testing of options against the dissolved oxygen standards. In 2007, the Environment Agency's consultants (WRc) reported that that the water quality (Estuary) model could predict dissolved oxygen levels which were overly pessimistic when compared to measurements in practice.10 WRc's subsequent review (in 2009) again noted that the model's dissolved oxygen predictions could be conservative, and suggested eight areas for improvement. The Environment Agency partially adopted these recommendations, but has not carried out another validation exercise since 2007. The Environment Agency told us that, although it would have been possible to increase confidence in the model results by obtaining more extensive data sets, it did not consider that any of the areas of uncertainty with the results were sufficient to justify the costs necessary to obtain any improved data.
| Figure 8 Simplified representation of the Tideway modelling framework |
|
| Inputs or outputs |
| Model |
| Data flows |
|
| Source: National Audit Office analysis of Thames Water modelling documentation | ||||||


________________________________________________________________
10 Two out of six simulated storm events predicted fails of the dissolved oxygen standards but monitoring station data suggested levels were compliant.