Outcomes
2.21 Given the criteria used to appraise options, the risk that modelling uncertainty influenced the choice of technological solution is likely to have been small. Only one alternative comparable in cost and delivery timetable to the Full Tunnel (the East-West Tunnel) came close to achieving the dissolved oxygen standards. As this solution would fail to limit pollution from approximately half of 'unsatisfactory' CSOs (Figure 9), it would have been eliminated irrespective of a compliant dissolved oxygen result which a more accurate Estuary model could have yielded. Our analysis indicates that CSO categorisation was not sensitive to inputs provided by the Sewer model: average flows would have to have been half their estimated level to cause any unsatisfactory CSOs to lose this status.
2.22 The Tunnel's storage capacity was designed to meet the requirement to accommodate volumes of wastewater resulting from all but the four largest spill events in the 'typical year' within the Thames Tideway Tunnel and the Lee Tunnel. The Environment Agency agreed this level of performance to achieve environmental objectives and compliance with the Directive, having regard for the future effects of population growth and climate change.
2.23 More accurate modelling could have resulted in a smaller, lower cost design of the preferred 'Full Tunnel' option. Refinements to Thames Water's sewer model after 2007 indicated that the planned capacity of the Tunnel would considerably outperform the 'four spills' threshold, allowing Thames Water to reduce the length of the reference design by 9 kilometres in 2009 (paragraph 2.18). Our review of modelling found that the sewer model could over-predict spill volumes, which could mean that a smaller diameter tunnel would limit pollution from all unsatisfactory CSOs while still meeting the four spills threshold. For a given capacity reduction, the Department's estimates suggest that this approach would reduce costs by less than was achieved through reducing the Tunnel's length. Further refinements could have reduced uncertainty about modelling and increased confidence that the Tunnel was the appropriate size, and cost, for delivering the project objectives.
2.24 The Department considers that a tunnel of smaller diameter would not have cost significantly less, based on Thames Water estimates from 2006. It considers that a smaller diameter tunnel would have carried a greater risk of non-compliance and fines, and that, following the 2012 ruling, the European Commission would have known it was possible to capture more spills with minor cost increase. The Department considers that the cost of rectifying a tunnel with inadequate capacity would be prohibitive, and that the Tunnel chosen offers greater certainty that the solution will be "future-proof".
Figure 9 Unsatisfactory CSOs and the routes of the Full Tunnel and East-West Tunnel1 solutions The East-West Tunnel would not have limited pollution in approximately half of the CSOs identified as 'unsatisfactory' by the Environment Agency along the Tideway |
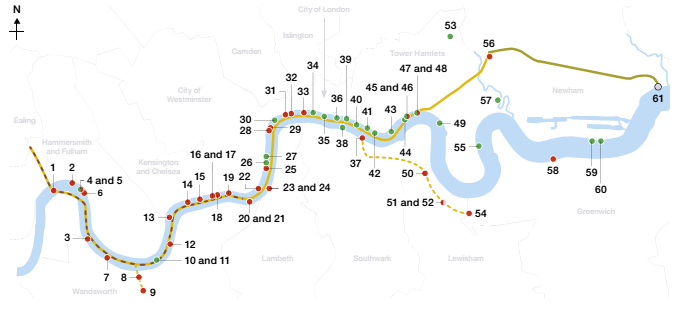
| Unsatisfactory |
| Unassessed3 |
| Thames Tideway Tunnel |
| Adequately performing |
| West Tunnel |
| Lee Tunnel |
Number and name of Combined Sewer Overflow | |||||


1 |
| Acton | 17 |
| Smith St. (storm relief) | 33 |
| Fleet | 49 |
| Blackwall Sewer |
2 |
| Stamford Brook | 18 |
| Ranelagh | 34 |
| Pauls Pier | 50 |
| Earl |
3 |
| West Putney | 19 |
| Western | 35 |
| Goswell St. | 51 |
| Deptford |
4 |
| Brook Green | 20 |
| South West | 36 |
| London Bridge | 52 |
| Deptford Creek3 |
5 |
| North West Relief | 21 |
| Heathwall | 37 |
| Shad Thames | 53 |
| Wick Lane2 |
6 |
| Hammersmith | 22 |
| Kings Scholar Pond | 38 |
| Battle Bridge | 54 |
| Greenwich |
7 |
| Putney Bridge | 23 |
| Clapham | 39 |
| Beer Lane | 55 |
| Isle of Dogs |
8 |
| Frogmore (Bell Lane) | 24 |
| Brixton | 40 |
| Iron Gate | 56 |
| Abbey Mills |
9 |
| Frogmore (Buckhold Rd.) | 25 |
| Grosvenor | 41 |
| Nightingale | 57 |
| Canning Town |
10 |
| Jews Row (Wandle Valley)2 | 26 |
| Horseferry | 42 |
| Union Wharf | 58 |
| Charlton |
11 |
| Jews Row (Falcon Brook)2 | 27 |
| Wood St. | 43 |
| Wapping Dock | 59 |
| Henley Rd. |
12 |
| Falcon Brook | 28 |
| Regent St. | 44 |
| Cole Stairs | 60 |
| Store Rd. |
13 |
| Lots Rd. | 29 |
| Northumberland St. | 45 |
| Bell Wharf | 61 |
| |
14 |
| Church St. | 30 |
| Savoy St.2 | 46 |
| North East Relief |
|
|
|
15 |
| Queen St. | 31 |
| Norfolk St. | 47 |
| Ratcliffe |
|
|
|
16 |
| Smith St. (main line) | 32 |
| Essex St. | 48 |
| Holloway |
|
|
|
Notes 1 The East-West Tunnel solution refers to the West Tunnel and the Lee Tunnel. 2 Local modifications in place since original classification mean that these CSOs are deemed to be satisfactorily controlled. 3 These CSOs have not been assessed using the Environment Agency's flow-based criteria. Source: Thames Water, London Tideway Tunnels Operating Techniques, 2012; Environment Agency, An Assessment of the Frequency of Operation and Environmental Impact of CSOs, 2005, p. 9; Bazalgette Tunnel Ltd., Summary of tidal Thames CSO controls, 2016 | |||||||||||