SECTION 2: The amount of NHS expenditure on PFI projects which went to pre-tax profit between 2010 and 2015.
20. In order to understand how much of the NHS budget which was allocated to hospitals went to pre-tax profits rather than patient care we needed to calculate the total amount which the NHS had paid to PFI companies. In this case NHS expenditure is calculated as the 'unitary charge' payments which the NHS has made to PFI companies between 2010 and 2016. These payments cover the cost of services provided with the PFI building and repayment of the money borrowed, with interest, for the hospital's construction. As such it represents the whole life cost of the asset and captures nearly all the income earned by the PFI companies over this time period.ix
21. As Table A shows, the £831m which left the NHS in the form of pretax profit (net of losses) between 2010 to 2015 in the 107 schemes we analysed is 8% of the money paid by the NHS to PFI companies. This is the size of the 'leakage' to profits after some of the funds received from the NHS had been used to make repayments on the loans the PFI companies had taken out in order to construct the building.x
| Table A: Percentage of NHS payments 2010 - 2015 which goes to pre-tax profit | |||||||
| Year | 2010 | 2011 | 2012 | 2013 | 2014 | 2015 | Total |
| NHS payments | £1.4bn | £1.6bn | £1.7bn | £1.8bn | £1.9bn | £1.9bn | £10.5bn |
| Pre-Tax Profit | £68m | £75m | £130m | £161m | £215m | £183m | £831m |
| % | 4.8% | 4.6% | 7.4% | 8.9% | 11.3% | 9.4% | 7.9% |
22. As Table B shows, in 13 contracts more than 20% of the payments made by the NHS over the six-year period went to pre-tax profit. For some NHS PFI contracts, the share of pre-tax profit was over 30%. The contract for the PFI scheme at University College Hospital London is especially concerning: our analysis shows that between 2010 and 2015 31% of the payments by the trust to the PFI company went towards pre-tax profits.
| Table B: NHS PFI schemes where over 20 % of NHS payments went to pre-tax profits * | |||||
| Procuring Authority | Project Name | Total NHS payments 2010-2015 £m | Total pre-tax profit 2010-2015 £m | % of NHS payments to pre-tax profit | Company (% equity stake) |
| Peterborough and Stamford Hospitals NHS Foundation Trust | Acute Hospital services | £212m | £80m | 38% | Peterborough Hospital Investments Ltd [InfraRed Capital Partners] (49%); JILF Holdings Ltd [John Laing] (30%); Macquarie Peterborough Hospital Investments Ltd [InfraRed Capital Partners] (21%) |
| County Durham and Darlington NHS Foundation Trust | University Hospital of North Durham - Dryburn District Hospital | £122m | £46m | 38% | Balfour Beatty (50%); Barclays Infrastructure Funds (50%) |
| University College London Hospitals NHS Foundation Trust | University College Hospital | £448mxi | £140m | 31% | Credit Suisse (43.3%); Semperian (40%); Interserve Plc (8.3%); Dalmore Capital (8.3%) |
| Buckinghamshire Healthcare NHS Trust | Wycombe & Amersham | £96m | £29m | 30% | Innisfree (100%) |
| Portsmouth | Provision of New Residential Respite Care and Day Care Facilities in Portsmouth and Associated Services | £4.7m | £1.4m | 29% | Interserve Plc (100%) |
| North Staffordshire Combined Healthcare NHS Trust | Reprovision of mental health facilities | £30m | £8m | 27% | Semperian (100%) |
| Gloucestershire Hospitals NHS Foundation Trust | Partial site redevelopment | £28m | £8m | 27% | Gloucester Healthcare Partnership Limited [Semperian] (100%) |
| Oxleas NHS Foundation Trust | Joint procurement to reprovide mental health services | £16m | £4m | 26% | RBIL Limited [Semperian] (100%) |
| Leeds Teaching Hospitals NHS Trust | Wharfedale Hospital | £12m | £3m | 26% | BAM PFI Investments (75%); Foresight Group (25%) |
| Kirklees | 5 new Primary Care Centres | £14m | £3m | 22% | Semperian (100%) |
| North East London NHS Foundation Trust | Goodmayes Hospital | £15m | £3m | 22% | Semperian (100%) |
| Hull and East Yorkshire Hospitals NHS Trust | Maternity and acute development - Hull Royal Infirmary | £18m | £4m | 21% | Semperian (100%) |
| Cornwall Partnership NHS Foundation Trust | Bodmin Hospital | £19m | £4m | 21% | Barclays Infrastructure Fund (100%) |
(Source: Treasury PFI Database, Companies House accounts)
*NB percentages will not exactly tie due to rounding of NHS payments and pre-tax profit figures.
23. Interestingly, 8 of these 13 contracts reached financial closure in 1997-2000, which makes them some of the earliest hospital PFI contracts entered into by the NHS. One explanation of why the profit levels are so high in these cases is that potential investors in the early PFI schemes considered them to be risky, because relatively few hospitals had been built in this way, leading them to seek a higher return.
24. However, as the PFI market became more mature and investors became aware that these types of contracts were less risky than previously thought, the risk premium will have tended to fall, so that in the later PFI schemes the returns required by the PFI companies will also have reduced.
25. Because of the exceptionally high rates of pre-tax profits declared by the company which runs the University College London Hospital scheme we looked at all the company's published accounts back to when the hospital first became operational in 2005. As Table C shows, between 2005 and 2015 UCLH NHS Foundation Trust has paid the company a total of £724.8m, out of which the company has made pre-tax profits of £190.4m and post-tax profits of £150.1m. This alone is enough profit to build an additional hospital given £150m is more than the individual capital cost of 102 of the 125 PFI building projects. The total capital value of the hospital, according to the Treasury, is £292m.xii Over the future of the contract UCLH will pay the PFI company a total of £1.95bn, which means that there will be a significant opportunity for the generation of future profits.xiii
| Table C: University College Hospital London PFI Scheme - Profit Loss Accounts 2005 - 2015
|
26. In fact, as can be seen in both Table A and Table C above, there is a trend towards increasing profitability over time in PFI contracts. This is expected, as the profitability of PFI contracts tends to follow a pattern of very low, or even negative, profits in the early years, but gradually increasing to reach very high levels in the final years of the contract.
27. This is because the debts incurred to construct the buildings are front-loaded and so are paid off early on in the contract. So in later years the unitary charge payment from the NHS is mostly profit after operational expenses are taken out.
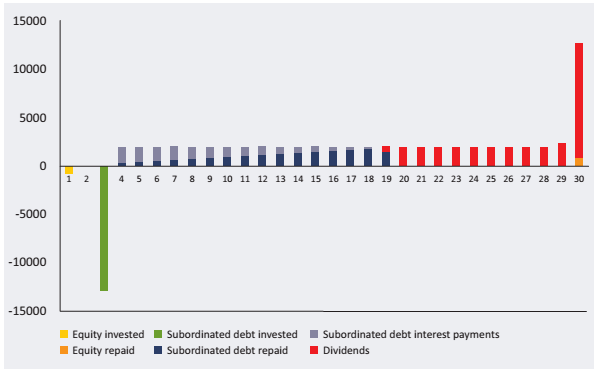
28. Figure 1 shows a generic cash flow profile for a typical PFI project. This demonstrates that an increase in profits (red bars represent dividends) is expected after debt (pale and dark blue bars) is paid off early on in the project.
| Figure 1: Cash flow allocation for a generic PFI scheme with equity draw down (£000).8
Source: Mark Hellowell, 2012 |
______________________________________________________________________________________
ix The total income (typically Turnover + Interest Receivable) in the SPV's accounts will differ from the unitary charge payments and some of the reasons for this are explained in the annex.
x Because not all the profit and loss data was available from the Treasury data set for all of the Department of Health's PFI schemes we had to estimate the amount of NHS payments to these companies which would go out of the NHS in the form of pre-tax profit. For the 18 schemes where there was no profit and loss data, the HMT data set shows that the NHS paid the PFI companies £259m between 2010 - 2015. Assuming that the percentage of NHS funding that went to pre-tax profit was the same as the average for each of the six years this would total a pre-tax profit of £20m. In effect, this analysis demonstrates that we could estimate that around £851m of NHS spending in these years had no direct benefits to patients receiving care.
xi As stated in the methodology 'Total NHS payments' is calculated as the unitary charge which captures almost all the NHS income earnt by the PFI operator in most cases. However for UCLH the SPV provides other facilities management and so the 'Total NHS payments' figure is calculated as the sum of turnover from the provision of services and the financial asset interest receivable which combined are greater than the unitary charge figure provided in the HMT data.
xii The SPV provides other facilities services for the hospital trust in addition to constructing and maintaining the PFI hospital so in this case the unitary charge figure has not been used. The funds paid by the NHS includes turnover from the provision of services and the financial asset interest receivable which combined are greater than the unitary charge figure. It is unclear whether the capital value provided by the Treasury includes capital enhancements and further building work carried out since the financial close of the contract in 2000. Any further work will likely increase the capital value.
xiii The HMT figure is nominal, not discounted, and will include the cost of services provided as well as repayments of borrowings to fund construction.