2.2 PFI use over time
HM Treasury publishes an annual database listing current projects which have already been agreed and signed. The most recent version of this database2 lists 728 projects, with a capital value figure (total worth of infrastructure assets) of just over £56 billion. This data shows that the use of PFI was at its highest in 2007/08, and has since declined (see figure below). This decline was seen following the introduction of tighter regulations on banks (under Basel III, a global voluntary regulatory framework), which increased lending costs for long term debt: Banks are responding to this accord by reducing risk-weighted assets rather than increasing equity capital. One way of doing this is to reduce lending to sectors such as infrastructure, which require funding instruments with long maturities.3 Additionally, PFI projects experienced an increase in costs and charges following the financial crisis, due to a reduction in available financing.4 In 2013/14, nine projects were agreed, with a capital value of £1.4bn. In comparison, in 2007/08, 62 projects were agreed, with a capital value of £8.4bn. There are 11 projects in procurement at present. | At present, there are 728 PFI projects which have already been agreed to, and 11 projects in procurement (as of 31 March 2014) |
Capital value of PFI projects agreed in each year (£ billion)
| PFI was widely used in mid 2000s, but has declined since its peak in 2007/08 |
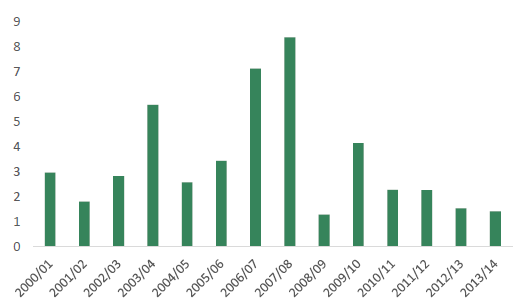
Source: HM Treasury, Private Finance Initiative projects, current projects as at 31 March 2014
Broken down further by government department, five departments account for 75% of the total capital value, and have procured a total of 477 projects out of the 728 projects reported in HM Treasury's database (table below). The projects vary greatly in size, from a school for £3m to aircraft costing over £2.5bn.
Current PFI projects
Department | Capital value | Unitary charge payments: 2015/16 | Total unitary charge payments: 2015/16 onwards | Number of PFI projects |
Department of Health | 12,083 | 2,025 | 66,315 | 123 |
Of which NHS | 11,845 | 1,961 | 64,944 | 105 |
Ministry of Defence | 9,043 | 1,838 | 31,871 | 41 |
Department for Transport | 7,879 | 1,238 | 27,592 | 62 |
Department for Education | 7,800 | 1,082 | 22,254 | 168 |
Scottish Government | 5,690 | 985 | 22,284 | 83 |
Other departments | 14,060 | 3,299 | 51,878 | 251 |
Total | 56,554 | 10,467 | 222,194 | 728 |
Notes: NHS figures are for all projects listed under the Department of Health with the exception of social care projects
Source: HM Treasury, Private Finance Initiative projects, current projects as at 31 March 2014.
Box 1: Accounting for PFI projects in the National Accounts National Accounts use the European System of accounts (ESA) to distinguish between on and off balance sheet debt. If the risks and reward of a project is believed to be passed to the private sector, it is not recorded in the government borrowing figures, and remains off balance sheet. Approximately 90% of all PFI investment is off balance sheet, and is not recorded in National Accounts.5 Public spending statistics, such as the Public Sector Net Debt, also follow ESA. The Office for Budgetary responsibility (OBR) states the following in relation to the off balance sheet classification for the majority of PFIs: As well as lacking transparency, this generates a perception that PFI has been used as a way to hold down official estimates of public sector indebtedness for a given amount of overall capital spending, rather than to achieve value for money.6 Only the PFI contracts recorded on the balance sheet of the National Accounts feed into Public Sector Net Debt figures. The OBR has stated that if all of the investment carried out through PFI was carried out through conventional debt financing, Public Sector Net Debt would have increased by 2% of GDP.7 |
___________________________________________________________________________________
2 HM Treasury, Private Finance Initiative projects, database version as of 15 December 2014, depicting projects as of 31 March 2014
3 Treasury Committee, Private Finance 2 Volume II, Tenth Report of Session 2013-14, June 2014, Ev w6
4 Treasury Committee, Private Finance 2 Volume II, Tenth Report of Session 2013-14, June 2014, Ev w6
5 National Audit Office, Choice of finance for capital investment, March 2015, p31
6 Office for Budget Responsibility, Fiscal sustainability report, July 2014, para 2.72
7 Office for Budget Responsibility, Fiscal sustainability report, July 2014, para 2.78