The impact of high PFI costs on NHS care
The high cost of PFI services and debt repayment coupled with underfunding has had a serious impact on NHS services. These effects have been evident since the policy began. PFI charges create an affordability gap that NHS organizations have sought to minimize at the project planning stage by reducing both the numbers of acute and community beds, services and staff (table). These cuts serve to redirect clinical spending to paying for capital. Extra money to bridge the affordability gap is also generated by selling land or by cutting services in other areas.
The first wave of hospital PFI projects was associated with average cuts in bed numbers of between 7 and 44 per cent, an average of around 30 per cent (table 5).31 By 1999, the government launched an enquiry into the national bed shortage that had resulted from these measures and called a temporary halt and a planned increase in bed numbers. But this policy was not enacted.
Table 5
Reductions in bed availability in England under private finance initiative (PFI) schemes
| PFI trusts | Best available current bed Nos | Nos planned (including 5 day beds) | % Decreases |
| England |
|
|
|
| Barnet General (Well House) Trust* | 646 | 411 | 36 |
| Bishop Auckland Hospital Trust | 565 | 454 | 20 |
| Bromley Hospitals Trust† | 619 | 507 | 18 |
| Calderdale Hospitals Trust ‡ | 832 | 508 | 39 |
| Carlisle Hospital Trust | 509 | 474 | 7 |
| Dartford and Gravesham Hospitals Trust* | 524 | 400 | 24 |
| Greenwich Healthcare Trust | 654 | 573 | 12 |
| Hereford Hospitals Trust | 414 | 250 | 40 |
| Norfolk and Norwich Acute Hospital Trust | 1 207 | 809 | 33 |
| North Durham Acute NHS Hospitals Trust | 750 | 450 | 40 |
| South Buckinghamshire Hospitals Trust | 806 | Refused |
|
| Swindon and Marlborough Hospitals Trust* | 632 | 450 | 29 |
| Walsgrave and Coventry Hospitals Trust | 1 145 | 1083 | 5 |
| Worcester Royal Infirmary Trust* | 697 | 390 | 44 |
| Total** | 9 194 | 6759 | 26 |
| Scotland |
|
|
|
| Lanarkshire Health Board16§ |
|
|
|
| All acute | 1482 | 1256 | 15 |
| All geriatric assessment | 226 | 200 | 12 |
| Lothian Health Board16¶ |
|
|
|
| All acute | 2234 | 1442 | 35 |
| All geriatric assessment | 661 | 415 | 37 |
| Total acute | 3716 | 2698 | 27 |
| Total geriatric assessment | 887 | 615 | 31 |
* Bed numbers taken from NHS Executive3. All others were supplied by the trusts themselves. †Includes 127 five day beds. ‡Includes 45 five day beds. §Projected figures for Lanarkshire were supplied by the health board and are based on Monklands, Law, and Hairmyres Hospitals. ¶Projected figures for Lothian were supplied by the hospital trusts. **The total percentage of bed losses was calculated by excluding hospitals where PFI projections were unavailable. NB: Some of the percentage decreases will underestimate the true loss as data were unavailable for smaller hospitals due to close as part of the PFI agreement.
Service reductions notwithstanding, financial difficulties continued in operational PFIs and by 2006 the Audit Commission was noting a 'marked correlation' between the presence of new large building projects and the presence of hospital deficits.32 In a separate joint study in 2006, the National Audit Office and Audit Commission reported a higher incidence of deficits amongst bodies with PFI schemes than those without (31% versus 26%, respectively).33
Our own analysis of NHS trust accounts for 2005/06 showed that this proportion is much greater for 'major' schemes - those which have a significant budgetary impact. In 2005/06, 50% of trusts with PFI projects with a capital value of £50 million or more were in deficit, compared with an NHS average of 23% for that year.34 In addition, among trusts that did not record a deficit in 2005/06, several recorded underlying financial problems in their annual accounts.
At the time, 'excess costs' ascribed to PFI by the Commission and PricewaterhouseCoopers were contributing to multi-million pound deficits across hospitals in south London and elsewhere. Ward and bed closures and sales of non- PFI parts of the NHS estate were accelerated at several sites. PFI hospitals, such as the one in Worcester, which was only viable in the first place because of the forced closure of a neighbouring hospital, were contemplating further large scale staffing cuts and service reviews as a direct result of growing PFI deficits.
BOX 1 The effect of underfunded capital costs in two areas
| To illustrate the effect of underfunded capital costs, we examine below the case of acute sector deficits in South East London, an area of severe deprivation and high health need, and Worcestershire. South East London This locality is administered by the South London and Maudsley Strategic Health Authority (SHA), which in 2007, showed that the financial problems relating to South-East London were worst at two PFI hospitals, Queen Elizabeth and Bromley.35 By the end of 2006/07, the aggregate debt payable by the four district generals to the SHA had increased to over £180 million, with Queen Elizabeth and Bromley accounting for about 84% of this. According to the SHA, the deficits of both trusts arise "because the cash costs of the PFI availability charge exceed funding for capital charges in tariffs." The SHA suggested that the solution was "further substantial reductions in staff costs and staff numbers." (p.10) Worcestershire The deficit problem is not restricted to London. Worcestershire Acute Hospitals NHS trust overspent by £4.9 million in 2005-06 and recorded a cumulative deficit of £31.8 million.36 The trust attributed £7 million of this to the costs of the PFI charge in excess of that funded through the tariff. The trust recorded its plans to reduce staff numbers by 675, and identified the need for a comprehensive review of services in neighbouring hospitals, questioned their sustainability and proposed substantial reductions in service. These cuts and service closures were apparently planned before contracts were signed in order to make the PFI scheme affordable. |
By 2012, PFI was widely acknowledged to be a source of hospital deficit and the department of health identified seven hospitals in need of further special support.37 Other hospitals only avoided deficits by further cuts in services. In at least one case, the National Audit Office concluded that the PFI contract was unaffordable from the word go and should not have been signed.38
The government has attributed deficits in several NHS hospital trusts to "a legacy of PFI debts".39 But indebtedness is not a consequence of historic costs alone. In several cases deficits have deepened as a result of a built-in tendency for PFI payments to increase annually in a period when hospital income is falling. This is because in most PFI contracts annual cash payments are indexed to the rate of inflation so that they rise year by year.
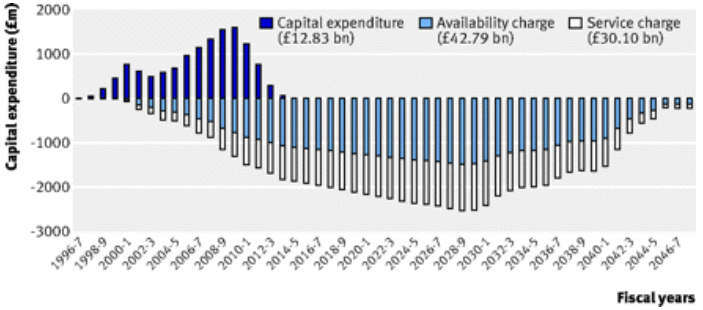
The aggregate of all PFI repayments in 2009-10 is £42.79bn. In 2010-11, NHS Trusts paid the private sector a total of £0.87bn in availability fees. However, the annual aggregate payments are set to increase, and at a time of real term reductions in public expenditure (figure 3).
Figure 3
Capital expenditure and unitary payments for 150 UK PFI hospital projects signed by December 2009.40
Indexation is arranged through complex financial instruments known as derivatives that add cash costs to hospital investment that would not otherwise be incurred. Although contrary to official guidance, certain types of derivative known as inflation swaps are widely employed in PFI deals. Inflation swaps can be used to lower initial PFI payments so as to make them look affordable when contracts are signed (they have no other function in the public sector). Affordability problems materialise when payments subsequently rise.
_______________________________________________________________________________________________
31 AM Pollock and Matthew Dunnigan. What happens when the private sector plans hospital services for the NHS: three case studies under the private finance initiative. BMJ 1997; 314 doi.
32 Audit Commission, 'Learning the Lessons from Financial Failure in the NHS', pp.27 July 2006, London.
33 National Audit Office and Audit Commission (2006) Financial Management in the NHS: NHS (England) Accounts 2004-05, London: The Stationery Office. Available at www.nao.org.uk/publications.
34 House of Commons Health Select Committee (2007) NHS Deficits. First Report of Session 2006-07 , Volume II, London: The Stationery Office.
35 South London and Maudsley Strategic Health Authority (2007), 'Acute Sector deficits in SE London'. London.
36 Pollock, AM., Price, D., Dunnigan, M., 'Deficits before patients: a report on the Worcester Royal Infirmary PFI and Worcestershire Hospital reconfiguration', June 2000, University College London, London.
37 BBC News. Seven NHS trusts to get access to £1.5bn bailout fund. 3 February 2012.
38 NAO, Report on Peterborough and Stamford Hospitals NHS Foundation Trust, 29 November 2012,
http://www.nao.org.uk/publications/press_notice_home/1213/1213658.aspx
39 BBC News. Seven NHS trusts to get access to £1.5bn bailout fund. 3 February 2012.
40 Hellowell M, Pollock AM. The private financing of NHS hospitals - politics, policy and practice. Economic Affairs 2009;29:13-19.