Contract Termination
There could potentially be a case for selective termination of contracts, either in circumstances where particularly poor value for money is an ongoing issue and where this would be addressed by voluntarily terminating the contract, or where operator performance on the contract is potentially so poor that contractor default could be enforced. If contracts were terminated, all risks associated with the assets would fall back to the public sector, termination compensation would be payable, and the value of the assets would become classified as public sector for national accounting purposes.
If local authorities borrow from PWLB (to fund termination liabilities) on the basis of level playing field support to be received from SG, then this would be considered to be supported borrowing and hence would create a call on SG's capital budget in the year in which the borrowing takes place, due to the UK budgeting rules under which SG operates. Given the scarcity of capital resources, it is not a priority to make capital budgets available to fund this supported borrowing even if a long-term value for money case existed, unless there is a persistent and significant underperformance issue to be addressed. Due to this general un-affordability of termination, we have not explored this option any further.
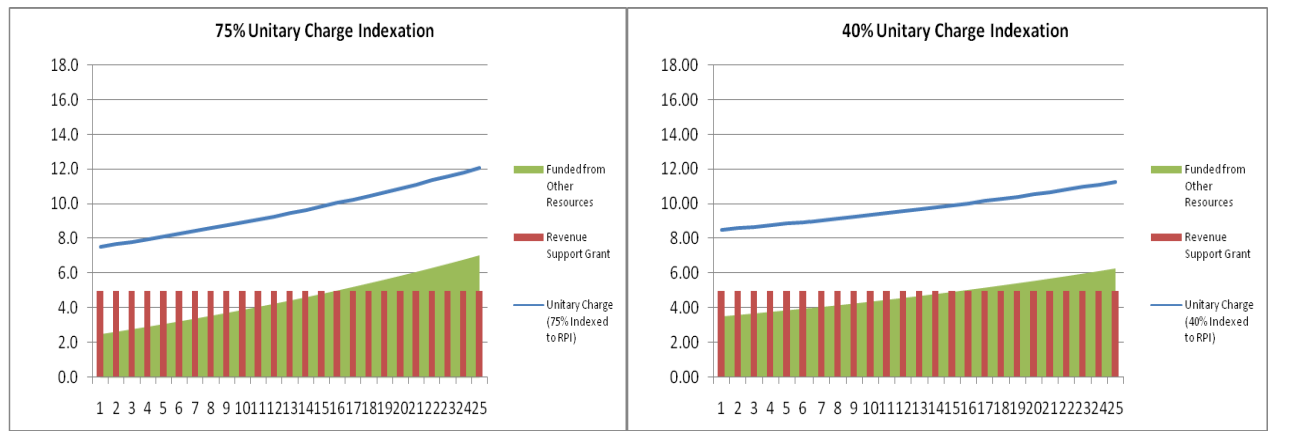
| Box 3 - Funding Structure - Local Authority Schools Project The graph below sets out the funding structure for a local authority schools project. In both examples below a fixed level (in nominal terms) of revenue support grant is committed from the Scottish Government (£5m), leaving the local authority to fund the remaining unitary charge due from their other resources. The authority can elect to grant either a higher level of unitary charge indexation (left graph - 75% indexation) and therefore reduce their early years unitary charge (UC) and funding requirement (in this example £7.5m UC and £2.5m in the first year), but require a higher UC and funding requirement at the end of the project (£12m and £7m respectively in example) or a lower level of indexation (right graph - 40%) and increase their early years UC and funding requirement (£8.5m and £3.5m respectively) but require a lower UC funding requirement at the end of the project (£11.2m and £6.2m respectively in example). Both scenarios assume a 2.5% inflation rate throughout the project term. The example in the left hand graph exposes the authority to greater inflationary risk. If the average inflation rate during the project end up being 4% not 2.5%, their funding requirement by year 25 increases from £7m to £11.3m. Whereas the same increase in inflation on the right hand graph would increase the funding requirement from £6.2m to £8.8m.
|