Annex A Charts and tables
| Chart A.1: Number of signed projects 1 per year and corresponding capital values 2
Key:
Source: Figures based on departmental and devolved administration returns. Current projects only- does not include projects that have expired or terminated. 1 'Signed' refers to when the project reaches financial close. 2 Normally calculated at financial close of individual contract. |
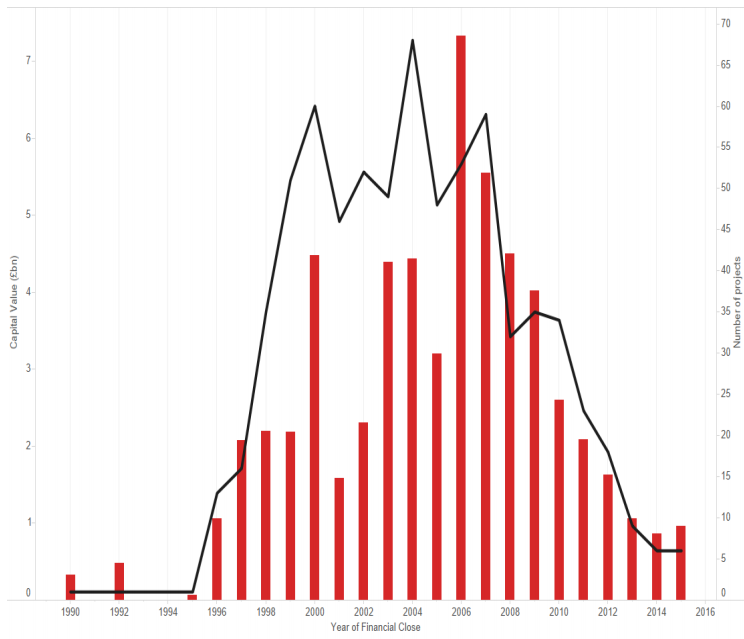
 Capital value (£bn)
 Number of projects
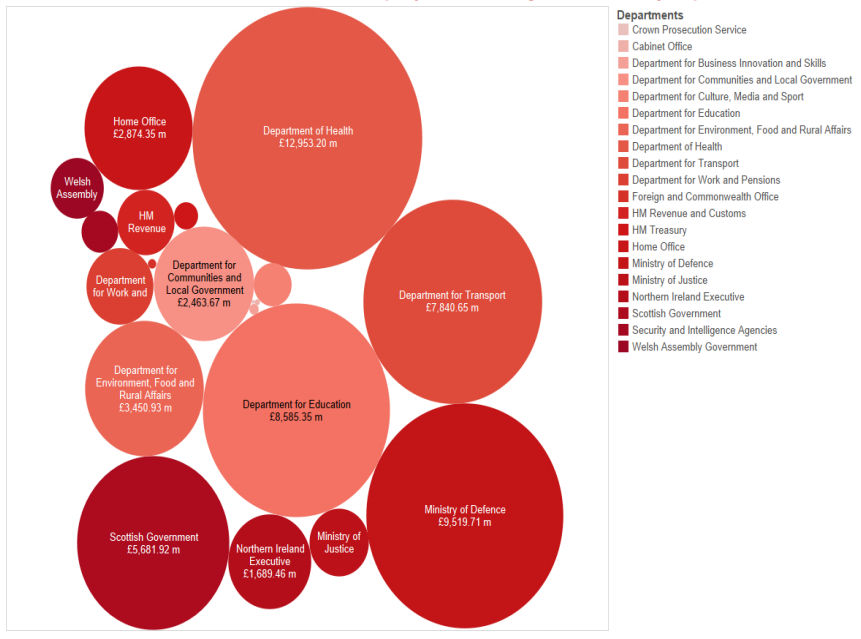
| Chart A.2: Portfolio of current PFI and PF2 projects across government by capital value
Note: Departments which have not been labelled and corresponding capital values: Cabinet Office (£6.7m), Department for Business Innovation and Skills (£21.8m), Crown Prosecution Service (£2.9m), Department for Culture Media and Sport (£352.4m), Foreign and Commonwealth Office (£17.1m), HM Treasury (£141.0m), Security and Intelligence Agencies (£331.0m). Source: Figures based on departmental and devolved administration returns. Current projects only- does not include projects that have expired or terminated. |
| Chart A.3: Capital value of PFI and PF2 projects within the UK
Source: Figures based on departmental and devolved administration returns. Current projects only- does not include projects that have expired or terminated |
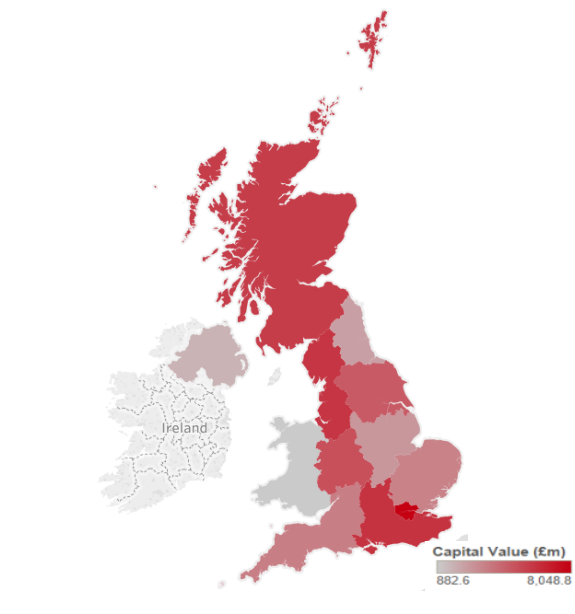
A.1 The map above indicates the value of projects within the different regions of the UK measured by capital value. Projects located in more than region are not reflected within this map.
| Chart A.4: Estimated future payments (in nominal terms, undiscounted) under PFI and PF2 contracts - current projects
Source: Figures based on departmental and devolved administration returns. Current projects only- does not include projects that have expired or terminated. |
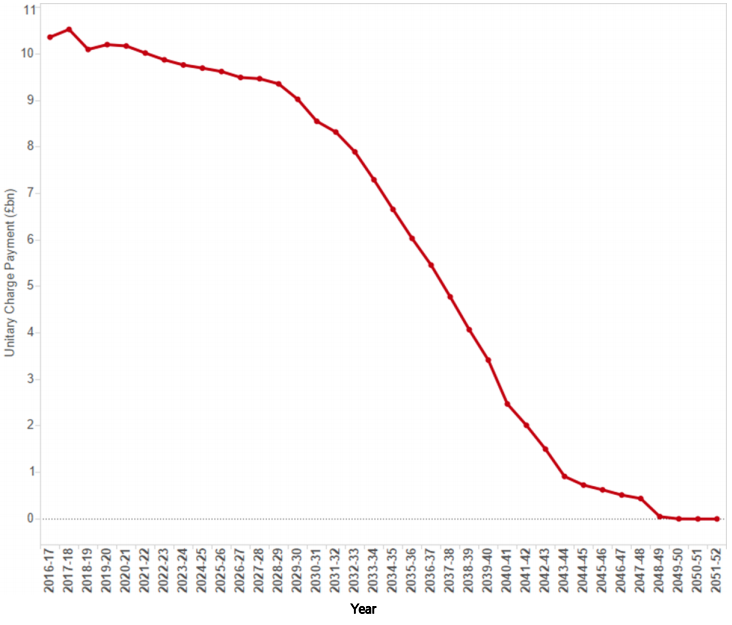
A.2 Please note that the drop in payments between 2017/18 and 2018/19 is due to seven projects reaching the end of their contract period, decreasing future payments by £552.5m.