The role of PPPs so far
3.3 In the surveyed states and central agencies, there have been at least 86 PPP projects in our main sectors of focus where a contract has been awarded and projects are underway - in the sense that they are either operational, have reached construction stage, or at least construction/implementation is imminent. Over 70% of these are in the roads sector. The other transport sectors have seen much fewer projects, with 8 ports (4 major and 4 minor ports), 2 airport and 2 rail projects underway. In the urban infrastructure sector, 11 PPP projects have been awarded, with 8 solid waste management, 2 water and sanitation and one bus terminal projects. Outside of the sectors of immediate interest and hence not included in the main text totals and charts, the survey found 6 PPP projects in e-governance and 2 in education. Though the coverage may not have been exhaustive for these last two sectors, it is clear that the potential use of PPPs in e-governance and health and education sectors remains largely untapped across India as a whole.
3.4 When looking at the total estimated project cost of PPPs, we see that road projects account only for 36 percent of the total because of the small average size of projects. Ports, with a much larger average size of project, account for 56 percent of the total. It is noteworthy that if ports and central road projects are excluded from the total, there is in fact a relatively small value of deal flow, at only Rs 30 bn in basic infrastructure PPPs to-date, suggesting a significant potential upside for PPP projects across sectors where states and municipalities have primary responsibility.
3.5 Across states and central agencies, the leading users of PPPs by number of projects have been Madhya Pradesh and Maharashtra, with 21 and 14 awarded projects respectively, all in the roads sector, and the National Highways Authority of India (NHAI), with 16 projects. The other states or central agencies that have been important users of PPPs are Gujarat (9 projects) and Tamil Nadu (7), Karnataka (4) and Ministry of Shipping, Road Transport and Highways (MOSRTH) (4). However, looking at a breakdown by estimated project size, we see that MP becomes significantly less prominent due to the large number of relatively small-sized projects in its portfolio, falling to 3 percent of total project costs. Gujarat accounts for 48 percent of total project costs due to its four large port projects. NHAI (17%) and MOSRTH (12%) are the other significant players. Karnataka accounts for 7 percent of total project costs given that its one awarded PPP project, the Bangalore-Mysore road corridor (currently under construction) had a reported project cost of Rs 22.5 billion.
| Figure 1: Number of awarded PPPs by sector (total = 86) |
|
| ||
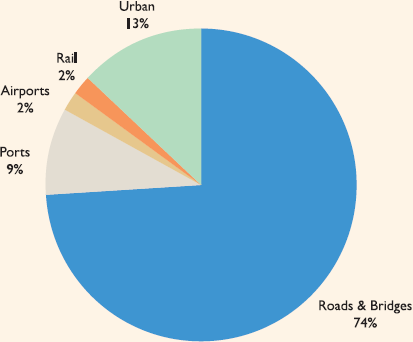
Source: PWC analysis
| Figure 2: Project cost of awarded PPPs by sector (total = Rs. 339.5 bn.) |
|
| ||
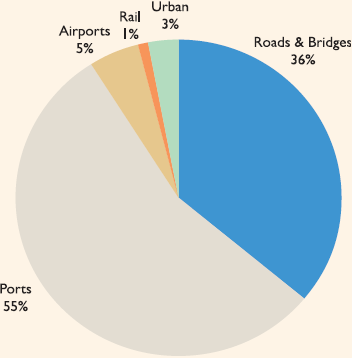
Source: PWC analysis
3.6 In terms of main types of PPP contracts, almost all contracts have been of the BOT/BOOT type or close variants. While it may be appropriate for central, state or municipal governments to promote PPPs that can be paid for by users if they are priorities, they may be missing out on other opportunities for more efficient private sector service delivery supported by ongoing public payments over time. Some examples of such other types of PPP contracts used to-date in India include the annuity contracts awarded by NHAI for roads, a small number of affermage-type (O&M with private investment) contracts, and a long lease in Maharashtra for the Mumbai-Pune expressway.
3.7 Anecdotal comments from the private sector suggest that a considerable number of un-bankable and unrealistic PPP projects are brought to the market by state governments. Data from the survey presented in the Annex show that there were 15 projects that have not moved forward past the award stage either because they have been abandoned or remained dormant. Of these, several had no good offers forthcoming in response to successive requests for expressions of interest. Although this number is not obviously high compared to the number of projects underway, it nonetheless suggests that there may be significant benefits from capacity building in identification and preparation of PPPs to ensure that more bankable projects are brought to market.
3.8 In terms of approach to provider selection, 93 percent of the projects in the sample were competitively bid (of which four-fifths used national competitive bidding), with only 7 percent procured either through Memorandums of Understanding (MOUs) or negotiated. However, it is worth noting that in value terms 42 percent of the projects were awarded on a negotiated/MoU basis.
| Figure 3: Awarded PPP projects by states & central agencies (total = 86) |
|
| ||
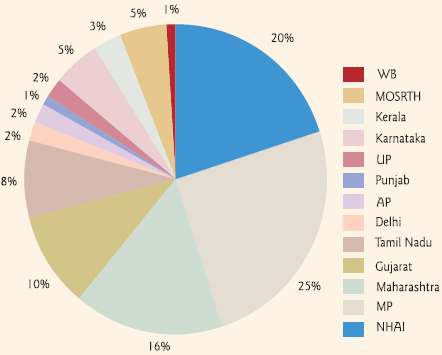
Source: PWC analysis
| Figure 4: PPP projects by states & central agencies (total = Rs. 339.5 bn.) |
|
| ||
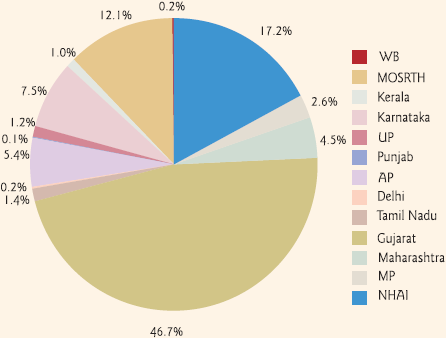
Source: PWC analysis