Development of the Z Model
To develop the Z Model, Altman used a sample of 66 companies, splitting the group into two subsets containing an equal number of members each. Group 1 consisted of a set of companies which, as per Chapter XI, had gone bankrupt in the period 1946-1965. On the other hand, Group 2 included those companies that were still going in 1966.
As to the five independent variables he selected, these were (i) the working capital to assets ratio, (ii) retained earnings to assets, (iii) Return on Assets (ROA=EBIT/A), (iv) solvency (E/D) and (v) asset turnover (ATO=S/A), stated in econometric terms as follows:
Z = 1.2X1 + 1.4X2 + 3.3X3 + 0.6X4 + 1.0X5
As regards the reasons to select these five indicators, Altman notes that the decision to use the Working Capital to Assets ratio is the result of the fact that such measure is usually a decisive factor of the company's liquidity and, as such, a decisive factor at the time of bankruptcy. Specifically, the studies revealed that, for companies that started experiencing operating problems, their liquidity levels relative to the size of assets started to decline abruptly.
The Retained Earnings to Assets indicator is what Altman refers to as one of the new indicators; according to the author, its relevance lies in that, assuming a stable dividend policy, it is possible to infer the life of the company. Accordingly, firms that are many years old have large amounts of retained earnings, whereas newer companies do not, where the average life of the firms is a critical element to predict bankruptcy.
The third indicator is return on assets before tax; such indicator reveals the firm's operating performance. In fact, ROA is nothing other than the accounting version of the value of the marginal product of capital; as can be expected, the lower this measure, the closer to the interest rate on the debt (via increased leverage due to equity deterioration) the higher the probability of bankruptcy. Naturally, it is this analysis that leads to the choice of the fourth indicator, the leverage ratio, which is presented via its inverse expression, the solvency ratio, in order to keep it consistent with a positive sign. Lastly, also connected to the determination of ROA, there is asset turnover; together with the margin, this explains the former.
| X1, Working Capital/Total Asset (WC/TA) The working capital/total assets ratio, frequently found in studies of corporate problems, is a measure of the net liquid assets of the firm relative to the total capitalization. Working capital is defined as the difference between current assets and current liabilities. Liquidity and size characteristics are explicitly considered. Ordinarily, a firm experiencing consistent operating losses will have shrinking current assets in relation to total assets. X2, Retained Earnings/Total Assets (RE/TA) Retained earnings (RE) is the term used to describe the account that reports the total amount of reinvested earnings and/or losses of a firm over its entire life. In addition, the RE/TA ratio measures the leverage of a firm. Those firms with high RE, relative to TA, have financed their assets through retention of profits and have not utilized as much debt. This ratio highlights either the use of internally generated funds for growth (low risk capital) or OPM (other people's money) - higher risk capital. X3, Earnings Before Interest and Taxes/Total Assets (EBIT/TA) This ratio is a measure of the true productivity of the firm's assets, independent of any tax or leverage factors. Since a firm's ultimate existence is based on the earning power of its assets, this ratio appears to be particularly appropriate for studies dealing with credit risk. Furthermore, insolvency in a bankrupt sense occurs when the total liabilities exceed a fair valuation of the firm's assets with value determined by the earning power of the assets. X4, Market Value of Equity/Book Value of Total Liabilities (MVE/TL) Equity is measured by the combined market value of all shares of stock, preferred and common, while liabilities include both current and long term. The measure shows how much the firm's assets can decline in value (measured by market value of equity plus debt) before the liabilities exceed the assets and the firm becomes insolvent. X5, Sales/Total Assets (S/TA) |
| The capital-turnover ratio is a standard financial ratio illustrating the sales generating ability of the firm's assets. It is one measure of management's capacity in dealing with competitive conditions. |
Source: Altman 2002
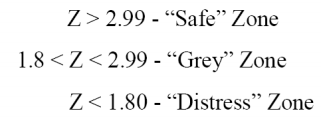
As to the results, the Z score means that when a company, considering its financial indicators, receives a value above 3 (three), the company is a healthy firm, whereas if such value is below 1.8, the company will end up entering bankruptcy. As to the 1.8-3 open interval, it is recognized as a gray zone.
Such an indicator represents a fundamental tool to monitor the financial health of a company and help in the early detection of possible financial distress problems. The early recognition of these types of problems is crucial to the adoption of corrective measures aimed to minimize the financial distress and, at the same time, prevent its spread over the firm's economic health and operative performance.